
Health Effects of Water Fluoridation: a Review of the Scientific EvidenceDid the Royal Society of NZ and the Office of the NZ Prime Minister’s Chief Science Advisor make a big mistake in their report Health Effects of Water Fluoridation: a Review of the Scientific Evidence)? Did they misrepresent a scientific paper which reported an effect of fluoride on the IQ of children?
This is what “Connett’s Crowd,” anti-fluoridation activists and propagandists, are saying in their attempts to discredit the review. So, did this review make the mistake its critics claim?
Well, no. It’s just a beat up. But there is a small mistake in the review’s executive summary which the anti-fluoridationists are pouncing on.
The issue
Most critics of community water fluoridation rely heavily on this paper:
Choi, A. L., Sun, G., Zhang, Y., & Grandjean, P. (2012). Developmental fluoride neurotoxicity: A systematic review and meta-analysis. Environmental Health Perspectives, 120(10), 1362–1368.
This was a metareview of mainly obscure and brief reports (see Quality and selection counts in fluoride research) indicating the possibility the fluoride intake by children living in high fluoride areas of China and Iran may suffer IQ deficits. Choi et al., (2012) used a statistical analysis to determine the possible size of the IQ drop averaged over all the studies. They found a small drop and said:
“The estimated decrease in average IQ associated with fluoride exposure based on our analysis may seem small and may be within the measurement error of IQ testing.”
Their abstract reported the:
“standardized weighted mean difference in IQ score between exposed and reference populations was –0.45 (95% confidence interval: –0.56, –0.35).”
(Their use of “standardised weighted mean difference” was poorly explained and has caused confusion with many readers. See below for a brief explanation of the term).
What did the Royal Society Review say about this?
The review discusses the question of possible neurotoxic effects on page 49-50. Their comment relevant to Choi et al., (2014) appears below (click to enlarge):
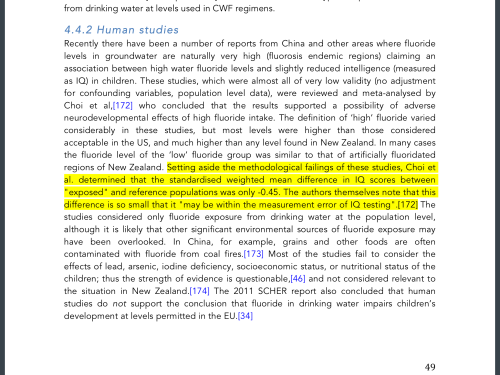
And this is what is in the executive summary (click below to enlarge). It makes a very small mistake by referring to “less than one IQ point” when it should have said “less than one standard deviation.”
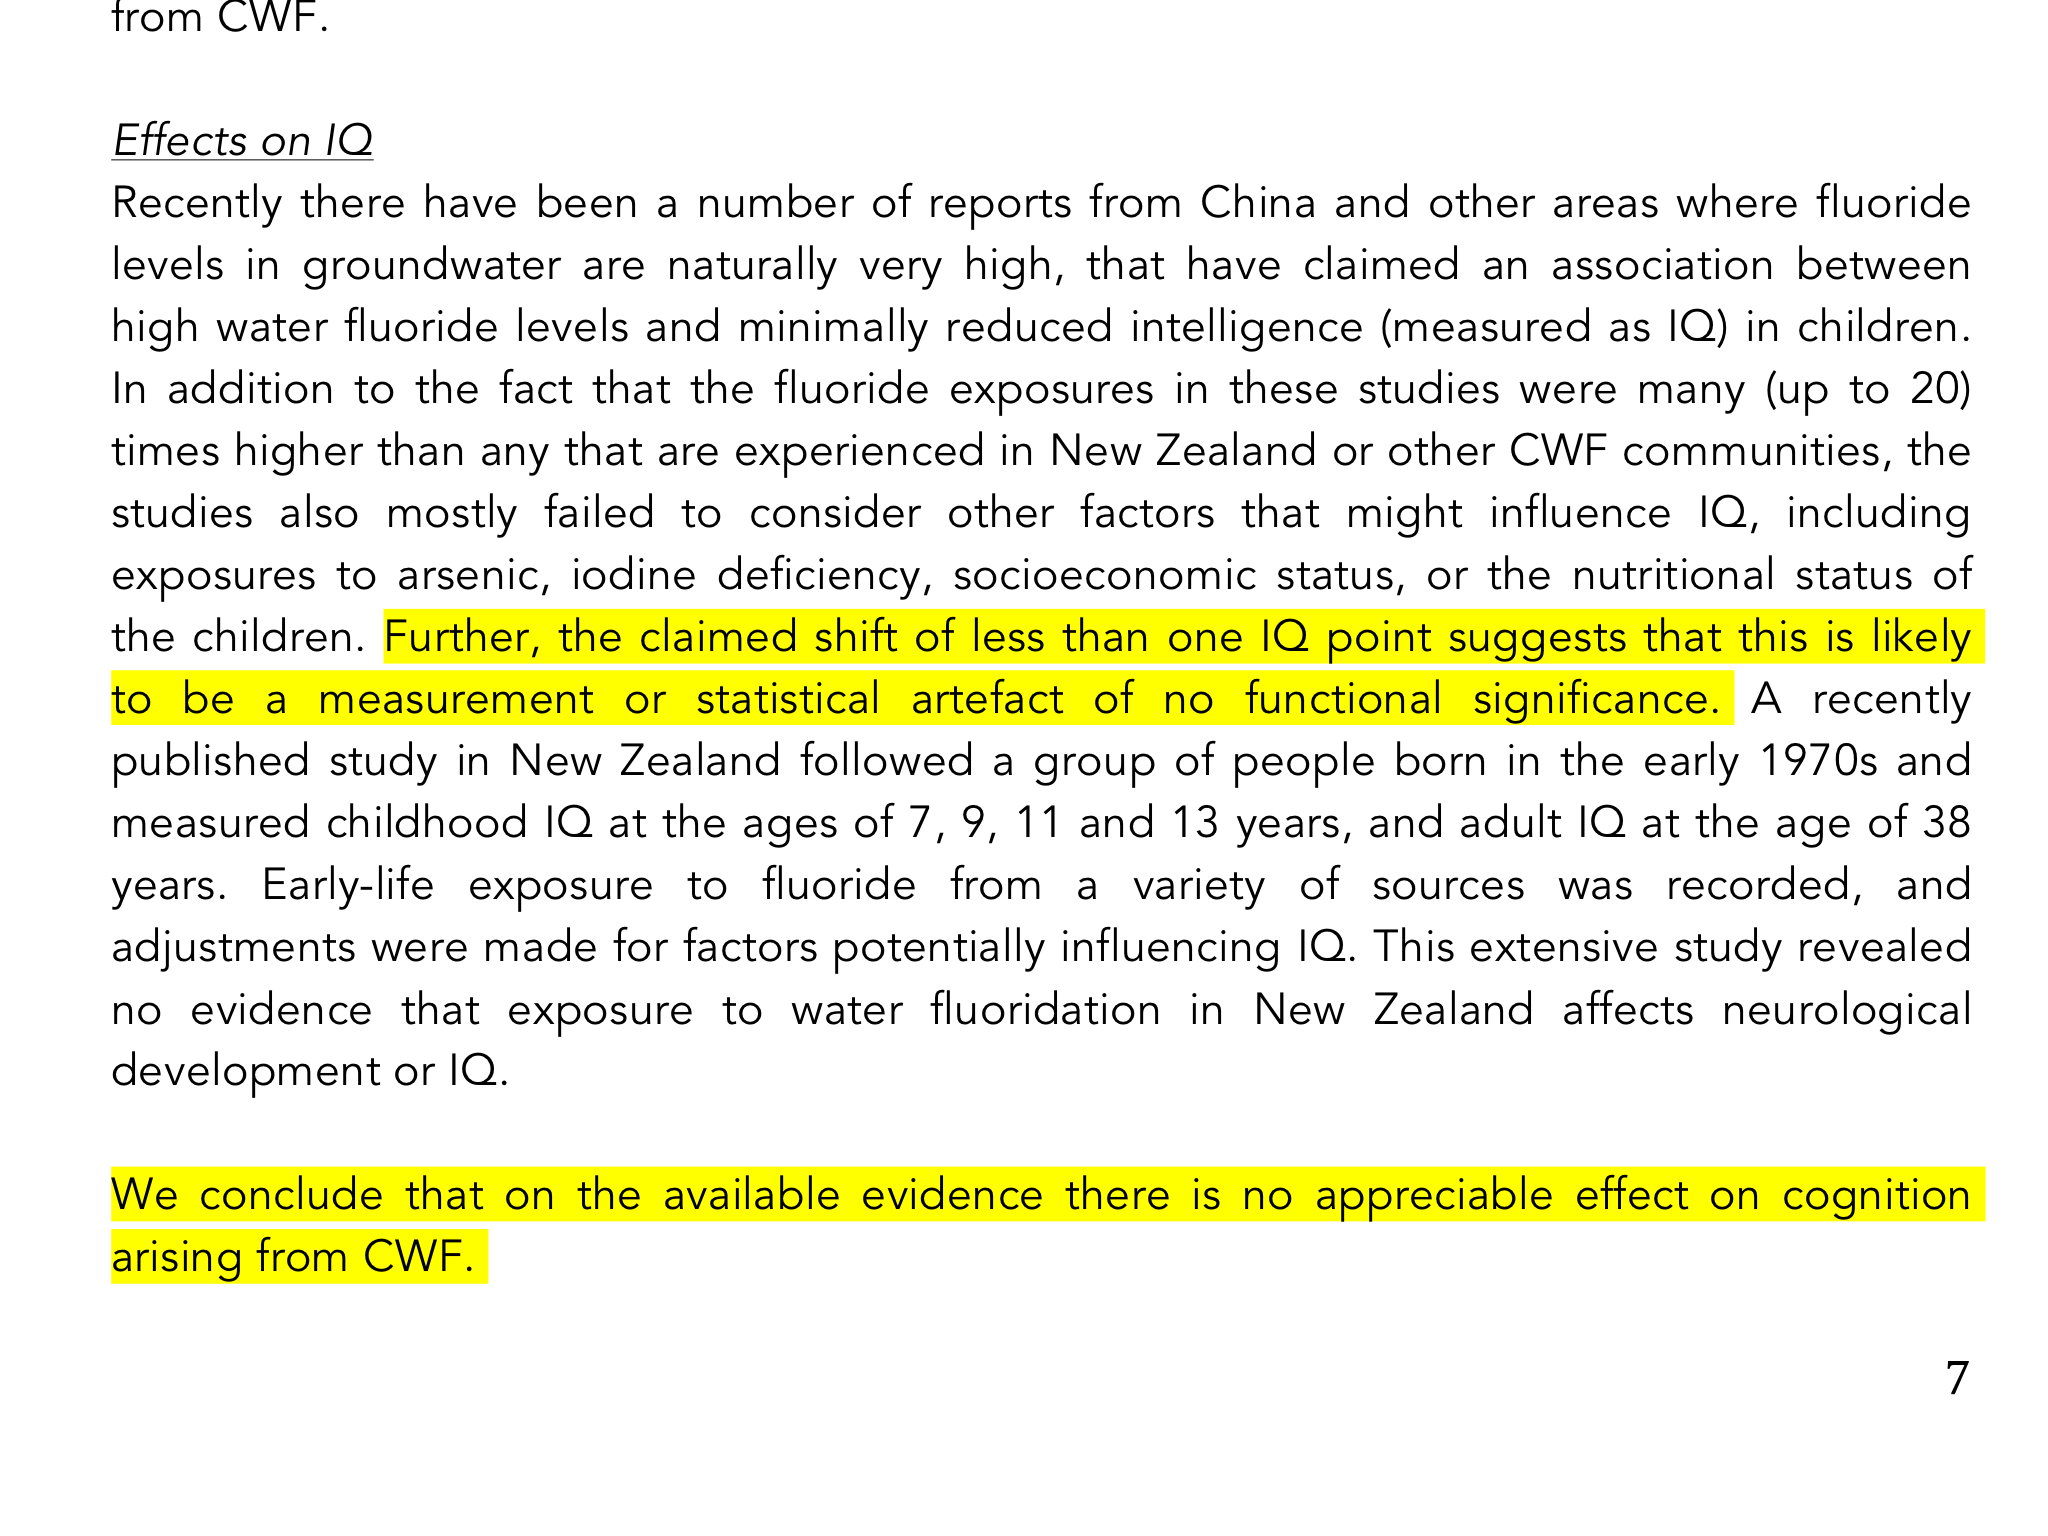
So, the review reported the Choi et al., (2012) findings accurately but made a small mistake in the executive summary. This is really of no consequence because the overall message of the small size of the estimated IQ drop (described by the authors as “small and may be within the measurement error of IQ testing”) is not really altered.
What do the anti-fluoride critics say?
Such mistakes are inevitable and authors will universally say they usually find them only after publication when no correction is possible. I remember picking up 5 mistakes in one of my papers – mainly incorrect spelling of my own name several times and a mistake in the address of my institution – those were the early days of word processing! Of course no one used my mistakes to cast doubts on the scientific content of the paper.
Still, “Connett’s crowd” have been merciless in their criticism. Here is an example from the big man himself (see Water Fluoridation: The “Healthy” Practice That Has Deceived the World):
Gluckman and Skegg (sic)* mistakenly claim “a shift of less than one IQ point” in the 27 studies reviewed by Choi et al. (2012). What they have done here is to confuse the drop of half of one standard deviation reported by the authors with the actual drop in IQ, which was 6.9 points. Such an elementary mistake would not have been made by Gluckman and Skegg (sic)* if they had actually read the report, instead of relying on what fluoridation propagandists were saying about it.
* Of course Gluckman and Skegg – who Connett calls The ‘Hollow Men’ of New Zealand – did not author this review.
H.S. Micklem, in the Fluoride Free NZ report on the Royal Society review, snipes:
“It is hard to imagine how this mistake could have been made by anyone who had actually read the papers that are disparaged so casually.”
I guess critics should read carefully before indulging in such snaky comments. All they have demonstrated is that they did not read past the executive summary of the review (and certainly did not read the relevant section in the review). Or, more seriously, that they wish to misrepresent the review by highlighting the mistake and ignoring what the review actually says.
(At Least Kathleen Thiessen was more honest in her comments in the FFNZ report because she did refer to page 49 as well as the mistake. However she still concluded “The RSNZ report is not accurate in its characterization of the Choi et al. (2012) article on effects of fluoride on children’s IQ.”)
Update: One of my commenters, picker22, has brought this to our attention – it puts the mistake mentioend above into context.
“The original press release from Harvard School of Public Health News service made the same error stating that the difference was .5 IQ points. This error on the part of Harvard led to more that a couple of mis-statements by fluoridation advocates in the US.
The current web page notes that the sentence reporting the magnitude of IQ change was “updated” Sept 5, 2012. Sadly, I didn’t copy the original.
http://www.hsph.harvard.edu/news/features/features/fluoride-childrens-health-grandjean-choi.html“
Is Choi et al (2012) relevant to fluoridation?
Not really.
The only study specific to community water fluoridation (CWF) the Royal Society review mentions is Broadbent, et al., (2014). Community Water Fluoridation and Intelligence: Prospective Study in New Zealand.
The Choi et al., (2012) paper reviews reports mainly from areas of endemic fluorosis where fluoride intake is much higher than areas using CWF. Subsequently the same authors made their own measurements in a similar area of China and did not find a significant relationship of drinking water fluoride to IQ (see Choi et al., 2014. Association of lifetime exposure to fluoride and cognitive functions in Chinese children: A pilot study).
The did, however, find a relationship of IQ to severe dental fluorosis. I discuss their findings in my article Severe dental fluorosis the real cause of IQ deficits?
What is this “standardised weighted mean difference”
This term caused a lot of confusion with readers and critics. Choi et al., (2012) used this statistical device because they were attempting to estimate the average decrease in IQ associated with fluoride exposure based on the difference in IQ between children from high fluoride villages and low fluoride villages in a large number of studies. Further, different IQ scales and measurement methods were used in the different studies which had different levels of variation in the data.
They therefore standardised the differences by expressing them as a fraction of the standard deviation for each study. A mean value over all studies was determined, weighting the contribution from each study according to the precision of the IQ measurements.
The standardised weighted mean difference value of 0.45 has meaning because we know it represents less than half of one standard deviation so it gives us an indication of how it compares with measurement error. But a value of 6.9 as used by Paul Connett is meaningless – until we are told the standard deviation. Choi et al. (2012) did not report a difference of 6.9 implied by Paul Connett who appears to have obtained that value from a response to a letter to the editor where they use a hypothetical example to explain the meaning:
“For commonly used IQ scores with a mean of 100 and an SD of 15, 0.45 SDs is equivalent to 6.75 points (rounded to 7 points).”


How did Broadbent control for any confounding constituents of the water of the mining areas of Taieri? 99 subjects?
LikeLike
How does this relate to the Royal Society Report or my article?
>
LikeLike
You should use http://www.donotlink.com when linking to Mercola 🙂
-Dan
LikeLike
Ken you pointed out how CWF said Choi had missing factors. Then you highlighted a sentence starting, “Further,” indicating both factors should be considered. Then for part of the evidence referred to in your next highlighted section a New Zealand study was referred to, which I believe would have been Broadbent’s. “Adjustments were made for factors potentially influencing IQ,” it was claimed about that study, in the words between your highlights. Broadbent’s study had 98 subjects in non-fluoridated areas. The study was around Dunedin, and Taieri would have been in the unfluoridated areas. I just wondered if anyone knows the Broadbent investigation sufficiently in regards to the wells or rivers the 98 non-fluoridated subjects had been drinking from and what the test results were for them. Naturally occurring mercury or such associated with gold mining might still be around. Taieri does not have a high rainfall and it could take a long time for heavy metals to be removed or flow to reservoirs or wells. Though the wells may not be in close proximity to the old Taieri gold mining they could still be polluted.
This being an epidemiological study a very small effect could indicate potential for greater effects on susceptible individuals. It would only take a few subjects of the non-fluoridated 98 to be getting extra mercury or arsenic for the group as a whole to lose its benefit when looking for a small epidemiological effect.
LikeLike
This is what I said about the Choi at al and the Broadbent et al (2014) studies:
Your comment is not at all relevant to this article – in fact it is a diversion. I am obviously not in a position to discuss details of someone else’s study beyond what is in their published paper.
If you have questions of Broadbent et al then write to them (first of all check their paper) – not me.
I would like to see discussion of my article, not your diversion.
>
LikeLike
The original press release from Harvard School of Public Health News service made the same error stating that the difference was .5 IQ points. This error on the part of Harvard led to more that a couple of mis-statements by fluoridation advocates in the US.
The current web page notes that the sentence reporting the magnitude of IQ change was “updated” Sept 5, 2012. Sadly, I didn’t copy the original.
http://www.hsph.harvard.edu/news/features/features/fluoride-childrens-health-grandjean-choi.html
LikeLike
Thanks for that information picker22. It does put the issue into perspective and makes the criticisms of the “Connett crowd” even more silly.
I might amend the post later to include this information.
>
LikeLike
Ken wrote: “If you have questions of Broadbent et al then write to them (first of all check their paper) – not me.
I would like to see discussion of my article, not your diversion.”
Ken your article seemed to me to be about which research is valid. Thanks for your suggestion and this may interest some:
Hi Johnathan,
Thanks for the study: “Community Water Fluoridation and Intelligence:” in which you set out to improve upon other studies.
We are in the submission period (closing Jan 10) for whether water fluoridation should be classed like a medicine. I am sending you these questions before I form my understanding of whether the classification may assist some proportion of individuals. Maybe it can be done as food labelling for persons who may experience shock reaction to certain foodstuffs. Though I do not think that is so developed as data sheets for drugs, like anaphylactic shock from penicillin.
Currently I am looking for whether fluoridation may skew distribution of IQ.
I note that your results do not appear discuss any skew. I also note you have given your measurements at the middle of your confidence intervals.
Since you do adjusted estimates it would be really interesting to see your distributions of control and experimental groups.
I also note you do not mention as an adjustment factor any consideration of toxic constituents of “control’ water maybe coming from headwaters from the former mining district of Taieri.
Sorry for the haste.
Brian Sandle
for reference:
Click to access FJ2008_v41_n4_p340-343.pdf
“Translated research report
Fluoride 41(4)340–343
October-December 2008
A study of the IQ levels of four-to seven-year-old children
in high fluoride areas
Wang, Yang, Jia, Wang
Analysis of the effects of high fluoride on the children’s intellectual
performance:
The intelligence quotient of the children can be divided into two
categories, namely, verbal IQ and performance IQ, to investigate the effects of high fluoride on each (Table 2). The results show that fluoride primarily affects the performance intelligence of preschool children, bringing down the IQ scores as a
whole. This suggests that we should pay special attention to the damage to performance intelligence when studying the effects of high fluoride on intellectual ability.
Comparison of the distribution of the IQ scores of children in the high fluoride zone versus the control zone:
When the distribution of IQ scores for children in the fluoride poisoned area and the distribution of IQ scores for children in the control group are each subjected to a moment method test of normal distribution, the IQ scores of the preschool children in the high fluoride areas show a flattened distribution, with a skewness coefficient of – 0.027, P = 0.892, and kurtosis coefficient of – 0.557, P = 0.146; The distribution of the IQ scores of the children
in the control zone show a slight negative skew, when a skewness coefficient of –0.330, P = 0.212, a kurtosis coefficient of 0.234, P = 0.655”
LikeLike
Thanks if anyone reading may help with understanding of this matter. This explains skewness and kurtosis: http://www.uky.edu/Centers/HIV/cjt765/9.Skewness%20and%20Kurtosis.pdf
The Wang figures give greater negative skewness for lower fluoride. To me I wonder if that means high fluoride improves intelligence in the low range or whether it means more in the low range die from some cause. The kurtosis seems to say high fluoride gives fewer IQs in the mid range, they are more spread out. Bit of learning to do. Help welcome.
LikeLike
I have also asked Broadbent if he can say more about those who did not survive into the adult study.
LikeLike
Soundhill, did you inform Broadbent that you are posting your correspondence here?
LikeLike
Richard, no I decided to put it here in case people are interested in submitting, or helping me.
LikeLike
“This is really of no consequence because the overall message of the small size of the estimated IQ drop (described by the authors as “small and may be within the measurement error of IQ testing”) is not really altered.”
That comment is dishonest, Ken, by leaving out, “seem” and the “substantial impacts” point.
The actual statement was:
“The estimated decrease in average IQ associated with fluoride exposure based on our analysis may seem small and may be within the measurement error of IQ testing. However, as research on other neurotoxicants has shown, a shift to the left of IQ distributions in a population will have substantial impacts, especially among those in the high and low ranges of the IQ distribution (Bellinger 2007)”
http://www.ncbi.nlm.nih.gov/pmc/articles/PMC3491930/?a_aid=3598aabf
LikeLike
Soundhill, you comment is dishonest. The authors clearly referred to the size of their estimated effect relative to measurement error because it was expressed in terms of standard deviation. Their later comment was speculative and based on other’s work for chemical toxicants.
Now, let me accuse you of misrepresentation by selective quoting. My assessment of relative consequence relates to the “mistake” in the executive sumnmary, not the size of the effect measured by Choi et al., (2012) as you imply. I wrote:
LikeLike
Ken may I ask readers to consider again that the RS report ought to be correct in every step when helping councils to rule people.
The report comments on a paper by Choi which says: “The estimated decrease in average IQ associated with fluoride exposure based on our analysis may SEEM small and may be within the measurement error of IQ testing. However, as research on other neurotoxicants has shown, a shift to the left of IQ distributions in a population will have SUBSTANTIAL IMPACTS, especially among those in the high and low ranges of the IQ distribution (Bellinger 2007)”
In other words Choi et al measured a decrease in IQ associated with high fluoride intake which *might* be a result of innaccuracy inherent in measuring IQ, but also it MIGHT NOT be. And if it is actual it may have an impact. Even though the shift may “seem small,” shifts to the left have “substantial impacts.”
The Royal Society report, in commenting, removed the word, “seem,” and the “substantial impacts,” point and I would say rather dishonestly CHANGED THE IMPORT, when they “reported”: “The authors themselves note that this difference is so small that it “may be within the measurement error of IQ testing.”
Furthermore that report says, “the claimed shift of less than
one IQ point suggests that this is likely to be a measurement
or statistical artefact of no functional significance.”
However Choi’s study said -0.45 difference, agreed that is less than 1 but Choi were referring to standard deviations of IQ, in other words more like 7 IQ points.
LikeLike
Soundhill, you appear to have just read Lisa Hansenâs open letter. She makes exactly the same point. I am responding with my own open letter (probably posted Monday).
Basically she does not understanding the meaning of standard deviation or of standardised weighted mean difference. A standard deviation of 0.45 does not automatically relate to a score difference of 7. One must know the standard deviation of the data set and its range before one can make that translation. For example try relating her talk of a SD of 15 to the results from Saxena et al., (2012) which she refers to.
You are wrong to claim: âIn other words Choi et al measured a decrease in IQ associated with high fluoride intake which *might* be a result of innaccuracy inherent in measuring IQ, but also it MIGHT NOT be. And if it is actual it may have an impact. Even though the shift may “seem small,” shifts to the left have “substantial impacts.”
The size of the difference measured by Choi et al amounts to 0.45 of the SD. This gives us an idea of the likely relevance as we can compare it with the measurement error or variability of the data set. It is a matter of relevance â there may be an actual mechanistic effect but the value of 0.45 tells us that the effect is relatively small and may not be detected.
You should have attributed you comment to Lisa, but anyway I am replying to her on Monday.
LikeLike
I haven’t seen Lisa’s work, don’t even recollect reading anything of hers. What is the ref?
“Fig. 2.6 (a) An illustration of how a mean shift of 0.5 of a normal distribution increases the probability of extreme positive values from 16% to 31% and decreases the probability of extreme negative values from 16% to 7%”
That is for a positive shift and we are talking a negative one.
http://www.esrl.noaa.gov/psd/psd1/review/Chap02/sec2.html
LikeLike
If the RS knew they were talking about standard deviations of IQ rather than points, and referred to less than 1 that would have to mean anything less than 1 sd, or perhaps as much as 0.95 sd. They should know that 0.95sd is quite a lot.
They either did not know what they were talking about or were trying to mislead. Both are very bad.
LikeLike
Soundhill, you criticism is the same as Lisa’s almost word for word. I draw much own conclusions.
Perhaps you should read the Fluoridation Review yourself. There is no confusion in their discussion of this issue. The small “mistake” was in the executive summary and is exactly the same as the mistake made by Harvard Univesity in their press release on this study.
Both the Review authors and Harvard University have corrected the mistake. If you want to attack the Review authors you need to attack Harvard University to be consistent. Are you going to do that?
You are just talking rubbish again with the silly comment on 0.95 SD. Get a life, for Christ’s sake.
LikeLike
Ken I clicked on your present link to the RS report and got my quotes from that.
It reads, (p7): “Further, the claimed shift of less than one IQ point suggests that this is likely to be a measurement or statistical artefact of no functional significance.”
LikeLike
I will update my link – you are looking at a previous version. I don’t know why the Royal Society hasn’t updated things.
The page says:
Erratum: the previous version of the executive summary of this paper stated that the claimed shift of IQ from fluoride exposure was less than one IQ point; it should have stated less than one standard deviation.
>
LikeLike
So that means the inference must be something like“Further, the claimed shift of less than one IQ STANDARD DEVIATION suggests that this is likely to be a measurement or statistical artefact of no functional significance.”?
LikeLike
Soundhill, why not check for yourself what the new text actually says – and if you contact the authors could you bring to their attention that the old version is still on line. I was told it would be replaced soon, but obviously “soon” mean’s different things to different people.
>
LikeLike
Ken: “Soundhill, you criticism is the same as Lisa’s almost word for word. I draw much own conclusions.”
Maybe it is more like two drivers coming up to the red light. One may be copying the other stopping but may be doing it by their own choice.
Most of the words were quotes, so if we both saw the fault it is obviously going to have a lot of common words.
I was led to the Scoop article by a Facebook group, then next went to Openparachute and decided to verify for myself the wordings.
Now I see Scoop has a link to Lisa’s article, and have skimmed through it. I can’t remember why I did not click on it but sometimes I like to know the story from my own enquiry before giving my attention to a group with a name like “New Health New Zealand.”
It’s not as if we are writing PhD theses. This is like School Cert 5th form where if two people get the same answers you don’t usually say they copied.
You referred to Harvard and that is where I got the 7, and maybe Lisa did, too.
“The average loss in IQ was reported as a standardized weighted mean difference of 0.45, which would be approximately equivalent to seven IQ points for commonly used IQ scores with a standard deviation of 15.*”
http://www.hsph.harvard.edu/news/features/fluoride-childrens-health-grandjean-choi/
Maybe both I and Lisa were both led there by you.
LikeLike
I bet Ken is rewriting his article about Lisa’s understanding of SDs. I could have left off the reference to the Harvard article until he posted on Monday, but I think it was more constructive to have given it today.
The Harvard link I got was July 25, 2012.
Maybe the RS was wrongly instructed by a version of the Harvard stuff before it was updated/corrected on Sep 5 2012? Copying….?
Or maybe both Harvard and RS and their reviewers were not reading Choi in sufficient detail.
LikeLike
The fact is Choi et al (2012) did not explain themselves very well from a laypersons point of view and a number of people misreported their results as IQ points rather than SD. (The Harvard University press release didn’t help).That is why they gave a response in 2013 explaining it and using, as a hypothetical example, a situation where the data set had a SD of 15. Unfortunately some people like Connett and Lisa (and you) have taken that literally to mean the IQ measurements always have a SD of 15. They don’t.
If you actually had read my article above until the end you would not have written your silly comment about me rewriting my open letter to Lisa. And what about reading the body of the review – clearly the authors understood the stats, even if you don’t.
Have you complained to Harvard University about their mistake yet? You should try to be consistent. 🙂
>
LikeLike
Ken are you talking about the older definition?
“When current IQ tests are developed, the median raw score of the norming sample is defined as IQ 100 and scores each standard deviation (SD) up or down are defined as 15 IQ points greater or less,[2] although this was not always so historically. By this definition, approximately two-thirds of the population scores an IQ between 85 and 115, and about 5 percent of the population scores above 125.[3][4]”
http://en.wikipedia.org/wiki/Intelligence_quotient
Choi: “Results: The standardized weighted mean difference in IQ score between exposed and reference populations was –0.45 (95% confidence interval: –0.56, –0.35) using a random-effects model. Thus, children in high-fluoride areas had significantly lower IQ scores than those who lived in low-fluoride areas. Subgroup and sensitivity analyses also indicated inverse associations, although the substantial heterogeneity did not appear to decrease.
Conclusions: The results support the possibility of an adverse effect of high fluoride exposure on children’s neurodevelopment. Future research should include detailed individual-level information on prenatal exposure, neurobehavioral performance, and covariates for adjustment.”
Choi also left out some studies such as the Trivedi Indian study where a lack of any high IQs made the distribution look as if it had a very narrow distribution, and hence small SD. I think they did not give SD but Choi must have calculated it from their data. I would feel a caution about that approach somewhat. Though it may be safe and not introduce selection bias. Might ask Choi to use non-parametric statistics to include more.
Not talking to Harvard who are not involved in possible NZ legislation like RS.
LikeLike
No I am not talking about definitions of IQ at all. Read my comments.
I find your refusal to criticise Harvard University for their mistake while ripping into the NZ review for the same mistake (only in the summary, not the body) hypocritical.
But I am not surprised.
>
LikeLike
The RS summary is so long it is more like the body of some studies.
The wiki IQ defines SD.
LikeLike
The NZ Fluoridation Review is relatively short compared with the extensive reviews it is based on. If you haven’t the ability to read the review you surely are not in the position to criticise it.
Measured standard deviation is determined by the variability within a data set. Do not confuse that with an idealised bell curve use to normalise IQ measurement. We are talking about the measurement error in data sets from real measurements..
>
LikeLike
My point is that the summary is 10% of the report and it is easy to forget one is only in the summary.
The RS report spends a lot of time explaining such things as correlation is not causation.
It ought to spend more time on its own contradiction:
“Because fluoride exhibits both beneficial and harmful effects,
the World Health Organization (WHO) recognises an adequate
lower level of intake and sets an upper limit on levels of fluoride in
water (range 0.5-1.5 mg/L). [10]
The recommendations are devised to ensure protection
against adverse effects over the course of a lifetime, including in
the most sensitive segments of the population.”
Then to hold to that stops it being prepared to explain in the report that whether or not the water is fluoridated is what makes the difference when in the following it says:
“The Australia New Zealand Food Standards Code specifies that
powdered or concentrated infant formulas containing >17μg of fluoride per 100 kilojoules (prior to reconstitution), or
‘ready to drink’ formulas containing >0.15mg fluoride per 100mL must indicate on the label that consumption of the formula may cause dental fluorosis.”
Ken, you challenge Connett’s 6.9 IQ points of difference. Do you think it is as bad a misinterpretation as the RS did?
The idea of doing a meta-analysis is to bring data together to give more power.
This thesis paper looking at problems of using standardised means
quotes: “The standardised mean difference standardises the results across trials allowing them to be combined in a meta‐analysis. The standardisation is obtained by dividing
the difference in mean outcome between two groups with the pool
ed standard deviation of the measurement. The result of this
calculation is that the outcome is measured in standard deviation units. These can be difficult to interpret and a rule of thumb ha
s been suggested, where a SMD of 0.2 standard deviation units is to be considered a small difference between the intervention groups, 0.5 a moderate difference, and 0.8 a large difference (12)”
Click to access tendal_thesis2010.pdf
That does not go into weighting there, but what do you think of those 3 numbers and do they apply here?
(Always remembering Choi is pro-fluoride and aiming to find the correct level.)
LikeLike
Soundhill, what do you base this claim on – “Choi is pro-fluoride and aiming to find the correct level.”?
Has she told you this?
My impression is that she is more concerned with the issue of possible IQ deficits in areas of endemic fluorosis rather than”correct levels.” It is telling that although Grandjean tries to grandstand to the anti-fluoridation people, this work is not be extended to the situation where CWF is an issue but to a Chinese village in an endemic fluorosis region.
>
LikeLike
From the intro of Choi’s 2014 study:
“Fluoride is a trace element that is necessary for the human body. A proper amount of fluoride not only prevents dental caries, but also promotes the use of calcium and phosphorus and the calcium sediment in the bone, stimulates bone growth andmaintains bone health”
They are working for the DHHS to set a level.
“Many relevant studies were identified that, collectively, supported the hypothesis that fluoride is a developmental neurotoxicant, but because many of the studies did not provide sufficient information about the neurobehavioral tests used and the testing conditions, the report recommended that additional, more rigorous research be conducted.”
And as a result of their findings:
“In response to this report, the U.S. Department of Health and Human Services (DHHS) is proposing to set the recommended level of fluoride in drinking water at 0.7 mg/L, the lower end of the current range of 0.7 to 1.2 mg/L, and the U.S. Environmental Protection Agency (U.S. EPA) is considering lowering the maximum amount of fluoride allowed in drinking water, which is currently 4 mg/L (U.S. EPA, 2011).”
It is different from NZ where the MAV is 1.5
Whether it is China or USA 4 is 4.
LikeLike
Your last comment is very confused, Soundhill. What are you trying to say?
Surely you aren’t claiming the the Choi et al (2015) pilot study resulted in the current recommendations which were in place well before the study!
>
LikeLike
Ken, I presumed that when Choi said, “In response to this report,” they did not mean the one they had been talking about in the previous paragraph, but their current study.
If there are earlier recommendations to lower the maximum allowable level from 4 to 1.5 and the recommended level to 0.7 in USA then I presume it needed confirmation by this study.
Are you claiming that effects of a level of 4 in China means nothing for a level of 4 in the USA?
LikeLike
Tendal’s opinion is that systematic reviews using SMDs are useful but must be used with care. Often they are working with effects of -0.1 as for paracetamol effects across studies.
Choi was being careful in 2012. I hope her exclusions were not biased. She said her -0.45 figure may seem small but implied that if it were actual it could have a substantial effect on people with above average or below average IQs.
Tendal found that in some cases errors could be large.
So not only is Choi’s 2012 study in doubt, so are several in the RS report.
In terms of your “special pleading” concept, the RS review should not apply one set of cautions to Choi, who was actually working towards bringing USA fluoride level to more like those in NZ, and fewer cautions to those systematic review studies are claiming benefits.
Those matters to be cleared up before the public can have confidence in our administration. Answers to Lisa Hansen as she inquires into that step on the way would help.
The answer, “it doesn’t matter now with Choi’s new study,” is not sufficient. Choi’s 2012 study brought up the doubt. The RS report seems to be claiming the doubt was not worth following up since it might have expected statistically without any real negative effect. Lisa Hansen is disputing that avoidance.
You Ken agree Choi measured IQ deficits in 2014 but you put them down to the appearance or feel of fluoridosis.
I have agreed that parental feedback or judgement could have affected the results. But I am doubtful about the strength if your hypothesis since the strong teasing of kids for having spectacles does not decrease IQ. They often have higher IQ. When I was supervising a kid to get specs there was a tremendous amount of energy put into getting frames that would not bring on him what he feared would be ridicule.
What the appearance of our fingernails may say about our health:
http://www.webmd.boots.com/skin-problems-and-treatments/ss/slideshow-what-your-nails-say
I find it hard to believe that white spots on the teeth are the only early effect of fluorosis. Antibiotics can worsen it:
http://www.webmd.com/oral-health/news/20051003/common-antibiotic-may-affect-tooth-enamel
Therefore I believe a mechanism ought to be sought and queried for whether it may apply only to faulty laying of tooth enamel, or effects in other organs. Antibiotics can produce deafness, too.
I ask that studies where urinary levels of fluoride are measured are considered for low urinary level indicating that the body is not able to excrete that unwanted amount. That seems to be opposed to what might be the first thought, that low urinary level might mean there is low burden.
If my hypothesis were correct that could indicate a case for choosing a preventive fluoride environment level for those individuals, perhaps as in polluted cities some people need to wear face masks.
Please don’t just work with means or medians, go to the tails of the distributions and their shapes.
LikeLike
You refuse to substantiate your claim that âChoi, . . . was actually working towards bringing USA fluoride level to more like those in NZ.â What is the evidence for that?
Surely her interest has been with the high fluoride areas â her 2012 metareview study selection was purposely biased towards Chinese and high F regions. No US region was included, let alone NZ.
Where is your evidence for your claim that the question of F and IQ doubts should not be followed up? In fact they have been followed up â both by Choi et al (2015) (in the endemic fluorosis areas she is interested in) and by6 Broadbent et al (2014) in the completely different low F areas where CWF is used.
The NZ Fluoridation review did not suggest Broadbentâs work was not worth doing, did it?
LikeLike
More recent Grandjean comment on the 7 IQ points:
http://ajph.aphapublications.org/doi/abs/10.2105/AJPH.2014.302532
LikeLike
“You refuse to substantiate your claim that âChoi, . . . was actually working towards bringing USA fluoride level to more like those in NZ.â What is the evidence for that?”
Going to my just posted article, if they only worked down to the level of NZ CWF pretty much. If they were trying to get it to a lower level they would have included lower levels in their study.
LikeLike
You are away with the birds, Soundhill, Choi et al (2015) do not declare any aims of the sort. There work is directed at areas of endemic fluorosis, not at areas where CWF is considered.
>
LikeLike
The work was funded internally by the organisations. There are several from China, I agree. 3 out of 10 are from the Harvard TC Chan School of Public Health which is 42% federally funded. So there must be some allegiance to USA. Besides what I stated at 11:10 am.
LikeLike
I repeat “In response to this report, the U.S. Department of Health and Human Services (DHHS) is proposing to set the recommended level of fluoride in drinking water at 0.7 mg/L, the lower end of the current range of 0.7 to 1.2 mg/L, and the U.S. Environmental Protection Agency (U.S. EPA) is considering lowering the maximum amount of fluoride allowed in drinking water, which is currently 4 mg/L (U.S. EPA, 2011).”
It is not as if the USA EPA has come across this after publication. They must be in with it to be mentioned in it.
LikeLike
You are confused, Soundhill. The report they refer to is the NRC report, not their own work. The NRC reciew was aimed specifically at checking whether the maximum levels should be reduced from 4 ppm. Choi et al have nothing to do with this. Ironically the issue was the level where CWF would not contribute to severe dental fluorosis – hence the recommendation to reduce to below 2 ppm where no severe dental fluorosis occurs.
LikeLike
Thanks, then the question arises of why they brought up the matter.
They say later: “The 2006 National Research Council report recommended additional research on the effects of fluoride in drinkingwater on intelligence with different exposure concentrations, the use of neurobehavioral tests that measure reasoning ability, IQ, and memory, as well as the use of comparison groups similar to the groups with higher exposures in terms of culture and socioeconomic status (NRC, 2006)”
So they perhaps intent to do that and this 2015 publication is their pilot study.
I can’t see the 2ppm anywhere.
LikeLike