-- What happens after the war – Mariupol
In journalism facts should be verifiable
Elections in Russia and Ukraine
Why has journalism, and Tucker Carlson, become so controversial?
RIP Gonzalo Lira
How could this happen?
Free Gonzalo Lira!
A neutral Ukraine would have prevented this mess
All governments lie – so does the media. Who should you trust?
Following the war in Ukraine – yeah, right
The Wagner mutiny in Russia and the internet
Will we say goodbye to free speech?
Reality bites – especially in a war
Disinformation – what it is, who promotes it, and how to combat it.
Nord Stream terrorism, UN failure, and “Official Secrets”
Secret “war-crime” warrants by International Criminal Court is mischief-making
Getting the full story about Ukraine
The west vs the rest – the world is changing
Ukraine commemorates Nazi collaborators
Do New Zealanders no longer support Ukraine?
The subtlety of neo-Nazi influence in Ukraine – ignored by our media
Where are Ukrainian refugees going? – an update
Is New Zealand covertly supporting the glorification of neo-Nazism?
Following the war in Ukraine – an update
Russian anti-war protester goes to see for herself
You can’t understand Ukraine without acknowledging its deep divisions
Once again, those Russian neo-Nazis – the Wagner group
A heartwarming story about a Ukrainian prisoner of war
Over 50 POWs killed. A military accident or a cynical war crime?
Ukraine/Russia war, an intelligence operation or a sting, Ukrainian and UK spies, and Bellingcat
Mainstream media defends poor journalism by smearing good journalism
Ukraine war – a shocking failure of our mainstream media
How is the war going?
Why should Ukraine listen to lame duck Boris Johnson?
Ukraine war – a failure of honest diplomacy and reason
British volunteer soldier in Ukraine speaks up
What about those Russian neo-Nazis?
Neo-Nazis in Ukraine – stages of denial
Confusion about neo-Nazis in Ukraine-Russia war
Neo-Nazis in Ukraine. Comedians are often more truthful than politicians.
Ukraine – a beginner’s guide
Why the silence on censorship?
Everything You Know About Ukraine Is WRONG
Some sense on the Russia-Ukraine war
British volunteer soldier in Ukraine tells his story
Virtue signaling over Ukraine
Fluoridation and child IQ – the problem of counting chickens before they hatch
August ’21 – NZ blogs sitemeter ranking
July ’21 – NZ blogs sitemeter ranking
June ’21 – NZ blogs sitemeter ranking
Anti-fluoridation group tells porkies about NZ fluoridation review
Opponents of fluoridation all at sea with new legislation
Update of NZ fluoridation review timely and useful
May ’21 – NZ blogs sitemeter ranking
Fluoridation contribution to heavy metals in drinking water is too low to measure
April ’21 – NZ blogs sitemeter ranking
Hip fractures in the elderly and fluoride – contradictory evidence
March ’21 – NZ blogs sitemeter ranking
An open letter to Paul Connet and the anti-fluoride movement
February ’21 – NZ blogs sitemeter ranking
Data dredging, p-hacking and motivated discussion in anti-fluoride paper
Censorship: Thinking you are right – even if you’re wrong
Embarrassing knock-back of second draft review of possible cognitive health effects of fluoride
The promotion of weak statistical relationships in science
Can we trust science?
January ’21 – NZ blogs sitemeter ranking
I don’t “believe” in science – and neither should you
December ’20 – NZ blogs sitemeter ranking
Science is often wrong – be critical
November ’20 – NZ blogs sitemeter ranking
Hyping it up over fluoridation
September ’20 – NZ blogs sitemeter ranking
August ’20 – NZ blogs sitemeter ranking
July ’20 – NZ blogs sitemeter ranking
Even studies from endemic fluorosis areas show fluoride is not harmful at levels used in fluoridation
Canadian studies confirm findings of Broadbent et al (2015) – fluoridation has no effect on child IQ
Child IQ in countries with endemic fluorosis imply fluoridation is safe.
Anti-fluoride 65 brain-fluoride studies not evidence against fluoridation
June ’20 – NZ blogs sitemeter ranking delayed
Another study used by anti-fluoride activists actually shows community water fluoridation OK
May ’20 – NZ blogs sitemeter ranking
When scientists get political: Lead fluoride-IQ researcher launches emotional attack on her scientific critics
New study touted by anti-fluoridation campaigners actually indicates fluoridation is safe
No relationship of bone cancer to fluoridation – another new study the anti-fluoride brigade will attempt to ignore
New review finds fluoride is not a developmental neurotoxicant at exposure levels relevant to fluoridation
April ’20 – NZ blogs sitemeter ranking
Anti-fluoride campaigners still rely on irrelevant studies
Author confirms anti-fluoridation activist misrepresentation of her work
Anti-fluoridation propaganda now relies on only four studies. 6: Incestuous relationship of these studies
Anti-fluoridation propaganda now relies on only four studies. 5: Don’t censor yourself
Anti-fluoridation propaganda now relies on only four studies. 4: Till et al (2020)
Anti-fluoridation propaganda now relies on only four studies. 3: Riddell et al (2019)
Anti-fluoridation propaganda now relies on only four studies. 2: Green et al (2019)
Anti-fluoridation propaganda now relies on only four studies. 1: Bashash et al (2018)
March ’20 – NZ blogs sitemeter ranking
No; a new study from Ethiopia does not indicate fluoridation is bad for your bones
Anti-fluoridationists put faith in new “strong” studies to provide evidence missing in draft NTP review
Industry-funded translation can introduce bias in selection of studies for scientific review
Another embarrassment for anti-fluoride campaigners as neurotoxic claim found not to be justified
February ’20 – NZ blogs sitemeter ranking
Beware of scientific paper abstracts – read the full text to avoid being fooled
January ’20 – NZ blogs sitemeter ranking
Fluoridation and sex steroid hormones – or the mouse that roared
What are the recent fluoride-IQ studies really saying about community water fluoridation?
December ’19 – NZ blogs sitemeter ranking
Fluoridation science and political advocacy – who is fooling who?
Scientific integrity & fluoridation – Dr Ghali responds
Sleep disorders and fluoride: dredging data to confirm a bias
Some fluoride-IQ researchers seem to be taking in each other’s laundry
Statistical manipulation to get publishable results
Scientific integrity requires critical investigation – not blind acceptance
November ’19 – NZ blogs sitemeter ranking
Anti-fluoride propagandists appear not to read the articles they promote
The anti-fluoride brigade won’t be erecting billboards about this study
October ’19 – NZ blogs sitemeter ranking
ADHD and fluoride – wishful thinking supported by statistical manipulation?
Experts complain to funding body about quality of fluoride-IQ research
What do these mother-child studies really say about fluoridation?
September ’19 – NZ blogs sitemeter ranking
Biostatistical problems with the Canadian fluoride/IQ study
Fluoridation – A new fight against scientific misinformation
An evidence-based discussion of the Canadian fluoride/IQ study
More expert comments on the Canadian fluoride-IQ paper
Politics of science – making a silk purse out of a sow’s ear
August ’19 – NZ blogs sitemeter ranking
Bye, bye to the collusion lie
If at first you don’t succeed . . . statistical manipulation might help
Anti-fluoride activists misrepresent a new kidney/liver study
July ’19 – NZ blogs sitemeter ranking
MH17 tragedy- 5 years on
June ’19 – NZ blogs sitemeter ranking
Chemical watchdog confirms suppressed report but justifies the suppression
May ’19 – NZ blogs sitemeter ranking
Does international chemical watchdog cherry-pick evidence to confirm a bias?
Psychology of Russiagate – an adult discussion for a change
April ’19 – NZ blogs sitemeter ranking
Russiagate – Some insights into its origins and results
Russiagate: Lessons for the media. But will they listen?
March ’19 – NZ blogs sitemeter ranking
Aftermath of the Mueller report – the media starts looking at itself
Mueller report to be released mid April – but it will be redacted
Collapse of the “Russiagate ” myth exposes how corporate media has failed
Getting out alive – why we should always demand evidence
Terrorism in Christchurch – some thoughts
“Disinformation” and the mainstream media
February ’19 – NZ blogs sitemeter ranking
January ’19 – NZ blogs sitemeter ranking
Preempting the annual misrepresentation of NZ dental health data by anti-fluoride activists
December ’18 – NZ blogs sitemeter ranking
Fluoridation: Another study shows stopping fluoridation bad for child tooth decay
November ’18 – NZ blogs sitemeter ranking
Media manipulation – the tail wags the dog
Protection of teeth by fluoride confirmed – yet again
And you thought Russiagate could not get sillier.
Trump and the media – codependents wallowing in the mud
Julian Assange’s mother appeals for her son’s freedom
October ’18 – NZ blogs sitemeter ranking
Nuclear dangers if INF treaty abandoned could be worse than in the 1980s
Fluoridation and ADHD: A new round of statistical straw clutching
September ’18 – NZ blogs sitemeter ranking
September ’18 NZ blog ranking – delayed
Flight MH17 tragedy in Ukraine – new evidence
Novichock detection and the Salisbury tourists
A more convincing take on prenatal maternal dietary effects on child IQ
Fluoridation: “debating” the science?
Opportunities and problems for grassroots activism offered by the internet
August ’18 – NZ blogs sitemeter ranking
Who is weaponising the vaccination debate?
Another BUK accident in Ukraine
Policing social media – who is coming next and who is behind it?
Political interference prevents investigators from considering the “bleeding obvious”
July ’18 – NZ blogs sitemeter ranking
Mainstream media “mob violence” over Helsinki summit
Blatant misreporting of latest OPCW report on chemical weapons in Syria
Time for a serious auditing of Porton Down’s nerve agent stocks?
June ’18 – NZ blogs sitemeter ranking
Anti-fluoride campaigners exhaust their legal channels with another loss
Magical World Cup Gala Concert
May ’18 – NZ blogs sitemeter ranking
Anti-fluoridation activists buy scientific credibility using a predatory publisher
Another shonky OPCW chemical incident report on Syria
Not just another rat study
Russian sports doping scandal looking like an illusion?
April ’18 – NZ blogs sitemeter ranking
Mainstream media-political alliance gets vindictive
Novichock – a marketing ploy?
The “heart of the Syrian chemical weapons programme” destroyed?
OPCW on Salisbury poisoning – one step forward, two back?
Anti-fluoridationist Paul Connett misrepresents NZ data
Anti-fluoridationists rejection of IQ studies in fluoridated area.
March ’18 – NZ blogs sitemeter ranking
A conference paper on the maternal prenatal urinary fluoride/child IQ study has problems
The 52 IQ studies used by anti-fluoride campaigners
The real lessons from Vladimir Putin’s re-election
Why is it so difficult to get an open discussion on fluoridation?
Mary Byrne’s criticism is misplaced and avoids the real issues
Anti-fluoride group coordinator responds to my article
Where could you get a nerve agent in Salisbury?
The first casualty . .
Paul Connett’s misrepresentation of maternal F exposure study debunked
February ’18 – NZ blogs sitemeter ranking
Anti-fluoride activist commits “Death by PowerPoint”
Paul Connett “updates” NZ MPs about fluoride?
Anti-fluoride activists misrepresent another thyroid study
Fake news from the White Helmets returns
RT election subversion – yet again?
January ’18 – NZ blogs sitemeter ranking
Yet another fluoride-IQ study
So you are saying . . . . . !
Jordan Peterson demonstrates the importance of free speech
Select your conspiracy theory and connect the dots
Whose who in the Russiagate affair – an infographic
A week of good news in New Zealand
Is “Russiagate” another deception like Iraqi WMDs?
“Fire and Fury” exposes the fundamental problems of the anti-Trump movement
Confirmation bias – we all suffer from it but how can we reduce its effect?
December ’17 – NZ blogs sitemeter ranking
Yet another way Russia is undermining our society
Anti-fluoridationists misrepresent New Zealand dental data – an annual event
Fluoridation means money in the pocket
Anti-fluoridation campaigners often use statistical significance to confirm bias
November ’17 – NZ blogs sitemeter ranking
The problem with scepticism
Chemical weapons use in Syria UN report flawed by political bias
Anti-fluoride “expert” finds the real reason oral health has improved – and it’s not fluoride
Meat substitutes – prospects and new ethical questions
October ’17 – NZ blogs sitemeter ranking
New fluoride debate falters
Political maturity in New Zealand – at least compared to the US
Flaw and porkie in anti-fluoride report claiming a flaw in Canadian study
Do we need a new fluoride debate?
September ’17 – NZ blogs sitemeter ranking
Endemic fluorosis and its health effects
Maternal urinary fluoride/IQ study – an update
Fluoride, pregnancy and the IQ of offspring
Facts about fluorosis – not a worry in New Zealand
We need more post-publication peer review
Cassini plunges into Saturn tonight – a grand finale
What’s with the anti-fluoridationist promotion of dental health programmes?
Non-violence in the defence of free speech
August ’17 – NZ blogs sitemeter ranking
Fluoridation not associated with ADHD – a myth put to rest
From Charlottesville to Boston – a lesson
Hypocrisy, irrationality and wise words from Monty Python
Are we all anti-fascist now?
Are fluoride researchers sacked for their findings?
Fluoridation and cancer
Local anti-fluoride activists tell porkies yet again
July ’17 – NZ blogs sitemeter ranking
The main stream media is out of touch
Don’t rely on sources – follow the evidence
Stovepiping to produce fake news
June ’17 – NZ blogs sitemeter ranking
Darwin, sexual selection and Putin
Fluoridation: Open letter to Democrats for Social Credit
Fluoridation: What’s happening with the New Zealand legislation?
May ’17 – NZ blogs sitemeter ranking
The “information war” and social media, or how to tell if you are a Kremlin troll
Anti-fluoridationists commonly misrepresent Ministry of Health data
ChildSmile – a complement, not an alternative, to fluoridation
Fluoridation helps protect adult teeth as well as children’s
Fluoridation: the truth about heavy metal contamination
Visualising the numbers – The Fallen of World War II
Bottle fed infants: fluoridated water not a problem
April ’17 – NZ blogs sitemeter ranking
Citing scientific studies and the arrogance of ignorance
Debating science
No, fluoridation is not associated with leading causes of death
Anti-fluoridationists exploit infant deaths by fiddling statistics
Here we go again
The Putin Derangement Syndrome
Bottle fed infants: fluoridated water not a problem.
March ’17 – NZ blogs sitemeter ranking
Another anti-fluoridation whopper
2018 Global Atheist Convention
Fluoridation: Making sense of the Ministry of Health data
Fluoride, coffee and activist confusion
Trump didn’t invent the problems – and his opponents didn’t invent protest
Anti-fluoride authors indulge in data manipulation and statistical porkies
Be careful what you wish for
An Oscar for Al Qaeda?
February ’17 – NZ blogs sitemeter ranking
EPA comprehensively debunks anti-fluoride claims of a fluoride-IQ effect
Anti-fluoridationists go to Supreme Court – who is paying for this?
Debunking a “classic” fluoride-IQ paper by leading anti-fluoride propagandists
Islamophobia or mental illness?
Tha Amnesty report – and a response from Syria
Non-fluoridated Christchurch does not have better teeth than fluoridated Auckland
January ’17 – NZ blogs sitemeter ranking
Debunking anti-fluoridationist’s remaining 12 reasons for opposing fluoridation
Madonna teaches us a lesson in critical thinking
New research confirms adults benefit from community water fluoridation as well as children
Premature births a factor in cognitive deficits observed in areas of endemic fluorosis?
Sources our mainstream media uses to promote their narrative about Syria
More nails in the coffin of the anti-fluoridation myths around IQ and hypothyroidism
Water fluoridation – what to expect in the near future
Fluoridation: New scientific review of fluoride and oral health
Critical thinking, not censorship, is the solution to fake news
Anti-fluoride IQ claims are false
December ’16 – NZ blogs sitemeter ranking
Large Swedish study finds no effect of fluoride on IQ
Fake news and the new fact-free reporting paradigm
Fluoridation: New research confirms it is cost effective – yet again
Fluoridation: members of parliament call from submissions from scientific and health experts
Fake news, human suffering and the fight against terrorism
November ’16 – NZ blogs sitemeter ranking
Sometimes I think the world has gone mad
Leader of flawed fluoridation study gets money for another go
White Helmets confirm authenticity of acted “rescue” video
Manufacturing news, and opinion, about Syria
Why should we subsidise religious leaders and their silly statements?
Warriors, scouts, Trump’s election and your news media
US elections – who should you be angry with?
Trump’s victory – why the surprise, why the anger?
Anti-fluoride claims often not relevant to New Zealand
October ’16 – NZ blogs sitemeter ranking
White Helmets dupes New Zealand government?
Voluntary media censorship is ethically wrong
Fluoridation not associated with hip fracture, heart attacks of osteosarcoma – new study
Anti-fluoridation activist Paul Connett has a senior moment about our debate
“Humanitarian” intervention and war crimes
Crocodile tears over Syria at UN security council
Anti-Syrian propaganda and the White Helmets
Shyness of anti-fluoride election candidates
Syria & the fog of war
September ’16 – NZ blogs sitemeter ranking
But will it stand up in court?
Flogging a dead horse – anti-fluoridationists lose in court again
Syria UN Ambassador makes sense of the war in Syria
The shaky Syrian ceasefire agreement staggers on – or does it?
Fluoridation & democracy: Open letter to DHB candidate Andrew Buckley
When will they ever learn?
Ceasefire in Syria is exposing real nature of “moderate” rebels
What do Syrians think of the new cessation of hostilities agreement?
Dissecting pseudoscientific and political propaganda
August ’16 – NZ blogs sitemeter ranking
An anti-fluoride trick: Impressing the naive with citations
Does community water fluoridation reduce diabetes prevalence?
“Filtering” out fluoride
Rio Olympics – what are those gold medals worth?
Fluoridation – freedom of choice
Is water fluoridation better than salt fluoridation?
Ethics and the doping scandal – a response to Guest Work
Being better informed – unexpected advice from The Guardian
July ’16 – NZ blogs sitemeter ranking
Quantifying the problem of international sports doping
Dental health – it’s not all about fluoride
The Putin diversion
The insult of low expectations
MH17 tragedy – 2 years on
Misrepresenting fluoride science – an open letter to Paul Connett
Are you really right?
June ’16 – NZ blogs sitemeter ranking
Why don’t feminists fight for Muslim women?
Permission to have that conversation
A cynical take on effective speakers
Richard Dawkins – speech to Reason Rally, 2016
Chemophobic scaremongering: Much ado about absolutely nothing
MH17 tragedy – new investigation launched
Fluoridation: News media should check press releases from anti-fluoridationists
Fluoridation debate: Responding to Tom O’Connor
May ’16 – NZ blogs sitemeter ranking
New review shows clear economic benefits from community water fluoridation
Debating fluoridation and tyranny – Tom O’Connor responds
Attempting a tyranny of the minority on fluoridation
Writing to please the reader’s ear
Fluoridation: One small step sideways?
New research confirms water fluoridation does not cause bone cancers
Public discussion of science can be toxic
Fluoridation cessation studies reviewed – overall increase in tooth decay noted
Mistakes were made – but by who?
Don’t be fooled by simple media “science”
“Do the math” – a bit like “Do the research!”
Victory Day celebration of defeat of terrorism in Palmyra
Will we be using contact lens cameras in future?
Barrel bombs, hell cannons, Aleppo and media bias
April ’16 – NZ blogs sitemeter ranking
Korean community water fluoridation supported by new evidence
Science and management – a clash of cultures
Anti-fluoride campaigners cherry-pick irrelevant overseas research but can’t find relevant New Zealand research
Cochrane fluoridation review described as “empty”
Anti-fluoridationists misrepresent new dental data for New Zealand children
A challenge to anti-fluoridationers to justify their misrepresentation of New Zealand research
Fluoridation decisions to be made by District Health Boards
Nadine gives a necessary message to her fellow Muslims
Anti-fluoridationists now scaremonger about silica in your drinking water
Reversed responsibility and the burden of proof
Anti-fluoridation cherry-pickers at it again
March ’16 – NZ blogs sitemeter ranking
Fluoridation: My podcast with with Howard Farran
Why is Donald Trump so successful – and will he win?
Why are our politicians so silent on Palmyra’s liberation from clutches of Daesh?
The US speaks in two tongues on terrorism
Chemistry is everywhere – even in those natural products
Life for women under Daesh (ISIS)
The toxicity of chemophobia
Anti-fluoridation campaigner, Stan Litras, misrepresents WHO
Hiding behind “experts”
The “interfaith” trap – particularly for atheists
A Chinese study the anti-fluoridation crowd won’t be citing
Misrepresentation, misogyny and misandry – these should concern sceptics
Searching articles on fluoride
February ’16 – NZ blogs sitemeter ranking
Big business funding of anti-science propaganda on health
Anti-fluoridationist’s flawed attacks on Calgary study
Scientific self-deception
Media misleading on Syria
Stephen Fry on Twitter
Richard Dawkins and the Skeptics Conference controversy.
Is the media lying to you about Syria?
Fluoridation: Whakatane teaches us something we should already know
Chemistry – “to dupe, to cheat?”
What a pleasant surprise!
Censorship by demonisation
Once more on the IQ and fluoride myth – why ignore other factors?
January ’16 – NZ blogs sitemeter ranking
Fluoridation: Whakatane District Council makes the Hamilton mistake
New study finds community water fluoridation still cost effective
“Crusade Against Multiple Regression Analysis” – don’t throw baby out with bathwater
Fluoridation: Some simple chemistry
The danger of insisting on your own facts
Flight MH17 in Ukraine – what do intelligence services know?
Iron and fluoride in human milk
Hubris of the google researcher
The Harvard study and the Lancet paper
Cultural and ideological bias in scientific literature reviews
Facts, beliefs and delusions
Science – a method of investigation, not a belief system
Yet another misrepresentation of a dental health study
December ’15 – NZ blogs sitemeter ranking
Peer review – the “tyranny” of the third reviewer
Syrian karma
Christmas – “White Wine In The Sun”
Community water fluoridation still cost-effective
Democracy and expert advice on scientific issues
Fluoride and IQ – another study coming up
The hardest thing in life . .
Climate deal signed – now for the hard bit: action
Traditions and social arrangements out of step with social diversity
“Natural News” on trial in The Hague for crimes against science
Rejection of scientific studies in online discussions
Another defeat for anti-fluoridation claims about arsenic
November ’15 – NZ blogs sitemeter ranking
The problem with reasoned discussion
John Pilger on Paris, ISIS and Media Propaganda
Science is never done – some scientific terms explained
Studies show – or do they?
Should we trust science? – Wellington talk
Can world leaders learn from the Paris terror attacks?
Anti-fluoride hypothyroidism paper slammed yet again
Cyberchondria and similar “illnesses”
Onehunga and the “fluoride-free” myth
Thames voters decisively support fluoridation
Why doesn’t Putin shirtfront someone?
October ’15 – NZ blogs sitemeter ranking
Scientific papers, civil disobedience and personal networks
The quackery of anti-fluoride internet trolls
Our beautiful planet: Astronaut art works
Christian co-option of karakia
Combatting anti-fluoride Gish gallopers
MH17: Final technical report
Responding to Tracey Brown on fluoridation
“The ugly truth” – Tracey Brown ticks me off
MH17 – another Boeing sacrificed for investigation.
The ugly truth about critics of “the ugly truth” in science
Many Syrians see Russians as saviours
Door knockers should pay to interrupt us
September ’15 – NZ blogs sitemeter ranking
Fluoride: More scaremongering using drug warnings
Putin’s UN address: “Do you realise what you’ve done?”
Obama’s United Nations address: “We Must Stamp Out ‘Apocalyptic Cult’ ISIS”
European and Māori major non-believers in NZ
Cochrane responds to misrepresentation of their fluoridation review
ChildSmile dental health – its pros and cons
Should all scientists really be militant atheists?
The Alternative Medicine Racket
The chemical party
A job with a view – but not for the clumsy
Fluoridation: Freedom of choice – and responsibility
My talk to the Reason & Science Society – an invite
Why the internet annoys chemists
Freedom of religion and belief – not a license to interfere with others
Humanitarian intervention – but when & how?
Discussing science on social media
August ’15 – NZ blogs sitemeter ranking
Australian census religion question – progress
In the end, it came down to the science in Denver
Subverting democratic consultation on the fluoride issue
Religious instruction scrapped from school curriculum in Victoria
Alternative reality of anti-fluoride “science”
What is life?
Anti-fluoride propagandists get creative with statistics
Fluoridation: Connett’s criticism of New Zealand research debunked
Fluoridation: Connett’s naive use of WHO data debunked
Time to give up on Sitemeter
Christmas reading
70th anniversary of first use of atomic weapon against civilians
Connett misrepresents the fluoride and IQ data yet again
Fluoridation: Newsweek science journalism bottoms out
July ’15 – NZ blogs sitemeter ranking
The bureaucratic solution to a problem
Fluoridation: “Sciencey” sounding claims ruled unacceptable
Comparing the Cochrane and NZ Fluoridation Reviews
Rapid change in attitudes to marriage equality
Scaremongering and chemophobia
MH17 tragedy: 1 year on
Talk of “mini ice age” bunkum
Progress in removing religious instruction from public schools?
Fluoridation: Beliefs about safety and benefits
Climate change: Our time really is running out
Cochrane fluoridation review. III: Misleading section on dental fluorosis
June ’15 – NZ blogs sitemeter ranking
Cochrane fluoridation review. II: “Biased” and poor quality research?
Cochrane fluoridation review. I: Most research ignored
What is causing warming of the earth?
New science bloggers wanted for Sciblogs 2.0
Gagging of scientists – a common problem?
I wish more people were aware of this
Misrepresentation of the new Cochrane fluoridation review
News media – telling us how to think
Misrepresenting the York fluoride review
Fluoridation: Misrepresenting the “saliva theory”
Something to consider
Fluoridation and horses – another myth
Science and social media in new Zealand
Monday morning proverb
Fake weight-loss study example of wider problem
Calcium fluoride and the “soft” water anti-fluoridation myth
May ’15 – NZ blogs sitemeter ranking
Connett & Hirzy do a shonky risk assesment for fluoride
Making mountains out of scientific mole hills
Don’t expect to see chemical safety data sheets in restaurants
Being open-minded
RSNZ Science Book Prize winner – Tangata Whenua
Don’t put all the blame on the Germans – a lesson from World War II
The problem of “Fact-Resistant Humans”
What a nice idea
Water fluoridation effective – new study
Follow the money?
The distrust of science – a task for science communication
We always seem to ignore the causes
April ’15 – NZ blogs sitemeter ranking
Wise words from Carl Sagan
Poor peer review – and its consequences
Connett fiddles the data on fluoride
ADHD link to fluoridation claim undermined again
Commercial and ideological support of anti-fluoride activity
Why is Vladimir Putin so popular in the USA?
Is comfirmation bias essential to anti-fluoride “research?”
The will to find out
IQ not influenced by water fluoridation
Making sense of scientific research
The frustrations of modern technology
March ’15 – NZ blogs sitemeter ranking
“Fair-weather” scepticism
Poor peer-review – a case study
The arrogance of science?
New Zealand science book prize – 2015 Short list
ADHD linked to elevation not fluoridation
Anonymous comments on social media
More poor-quality research promoted by anti-fluoride activists
Ukrainian “suicides?”
Free download – “Severe dental fluorosis and cognitive deficits”
Are submissions on fluoridation worth it?
Social media and science – the problems and the challenge
A couple of “oldies” inject some sense into international politics
Open letter to Lisa Hansen on NZ Fluoridation Review
February ’15 – NZ blogs sitemeter ranking
Paper claiming water fluoridation linked to hypothyroidism slammed by experts
Dirty tactics by anti-fluoride activists in Taupo
NZ Fluoridation review – Response to Micklen
NZ Fluoridation review – HS Micklen responds to critique
Did business interests interfere with Hamilton’s fluoride tribunal process?
A perspective of distances in space
Download report analysing anti-fluoride attacks on NZ Fluoridation Review
Social health policies, freedom of choice and responsibility
Reality of war for civilians
Stephen Fry not pulling any punches
January ’15 – NZ blogs sitemeter ranking
US meddling in Ukraine behind coup
Hypocrisy
Sunday reading – Richard Dawkins reads some of his “fan mail”
Is debating with anti-science activists worth the effort?
Six months on – concerns about MH17 investigation
Severe dental fluorosis and cognitive deficits – now peer reviewed
Those evil chemicals
“Internet and social media misinform thousands daily”
“I just know”
The victims of terror
Fluoride Free NZ report disingenuous – conclusion
Spotting Bad Science
October ’14 – NZ blogs sitemeter ranking
December ’14 – NZ blogs sitemeter ranking
The MH17 blame game
Down-under Christmas
Science never claimed to know everything
Special pleading by Philippe Grandjean on fluoride
The inverted ethics of doxxing?
Fascinating and painless chemistry lessons
Did the Royal Society get it wrong about fluoridation?
“Do your own research!”
Dirty politics over MH17?
Cherry-picking and misinformation in Stan Litras’s anti-fluoride article
Today’s fantasy, tomorrow’s possibility
The farce of a “sciency” anti-fluoride report
November ’14 – NZ blogs sitemeter ranking
Creationist ‘audits’ science museum
“Real” experts’ on climate change? Really?
Water fluoridation and dental fluorosis – debunking some myths
Proving anecdotes are reliable
Declan Waugh pushes another anti-fluoride myth
Severe dental fluorosis the real cause of IQ deficits?
Catch 22 in Ukraine
Let’s rely on anecdotes instead!
Standing up to junk science in New Zealand
Declan Waugh claims it’s “clear as day”
Unusual photo of Moon and Earth.
Criminal investigation of MH17 tragedy – where is it at?
There is something about those climate records that keep getting broken
Putting politicans in their place on climate change
Malaysia Airlines Flight MH17 – what really happened?
Fluoridation – a racist conspiracy?
Curiosity’s historic comet photo
When science deniers turn to science
Fluoride debate: Second response to Rita Barnett-Rose – Daniel Ryan
Fluoride debate: Response to Daniel Ryan’s critique – Rita Bartlett-Rose
Fluoride debate: A response to Rita Barnett-Rose – Daniel Ryan
Fluoride debate: The scientific evidence against fluoridation – Rita F. Barnett
Another legal defeat for NZ anti-fluoridation activists
Anti-fluoridation propagandists promoting shonky “review”
How to change your Mind – and why it is good for you
The science and politics of climate change
Science and belief
September ’14 – NZ blogs sitemeter ranking
Peer review of an anti-fluoride “peer review”
The information war – The NZ Listener takes up arms
MOM “a thousand times better than cricket”
Activist’s anti-science adverts found misleading – again
Don’t you get tired of this?
It’s time we did something about sugar
Crude dredging of the scientific literature
Anti-fluoride activists define kangaroo court as “independent”
MH17 – Preliminary report leaves most conspiracy theories intact
Do you prefer dental fluorosis or tooth decay?
Emotion Drives Decision
Ingested fluoride, dental health and old age
August ’14 – NZ blogs sitemeter ranking
Sad news – Victor Stenger has died
Making money out of fanatics
Dirty politics on the Royal Society fluoride review
Review finds community water fluoridation safe and effective
Anti-fluoride activists unhappy about scientific research
The Mind of the Science Denier
Open letter to Jane Nielson – a “fluoridation convert.”
Accidental Renaissance – or intuition?
Tactics for science denial
Natural News comes out with a load of heavy metal rubbish on fluoride
July ’14 – NZ blogs sitemeter ranking
Declan Waugh continues his distortion of Finnish fluoride research
Another fluoridation whopper from Declan Waugh
I am still waiting for my cheque
An answer to the anti-fluoride critics – in one image
Some answers to the confusion about the #MH17 crash site
Informed parents know water fluoridation is good for their children
Making political capital out of the deaths of innocents
Elected officials must ignore activists and listen to own voters
The irony of some peer-review and citation complaints
Ken Ring pontificates on climate change
Anti-science US Congressman on House science Committee!
“Creative” reporting of fluoridation science
What happens when fluoridation is stopped?
June ’14 – NZ blogs sitemeter ranking
Controversial IQ study hammered in The Lancet
New group challenging the anti-science brigade
Fluoridation: what about reports it is ineffective?
Approaching scientific literature sensibly
Declan Waugh’s misinformation on fluorosilicic acid
A healthy attitude towards quantum mechanics
An open letter to Declan Waugh – new mechanism for fluoride toxicity?
Toxicity is in the dose or concentration of fluoride
Councils and scientists targeted by anti-fluoride activists
Lugansk – a modern Guernica?
Inna Kukuruza – “her eyes spoke to the whole world”
Connett’s hypocrisy on fluoride & IQ
May ’14 – NZ blogs sitemeter ranking
Confirmation blindness on the fluoride-IQ issue
Where do teeth come from? The stork theory
There is research and there is “research”
Fluoridating water does not lower IQ – New Zealand research
Fluoride and IQ – once more
Another anti-fluoride myth in the making
A balanced debate
It’s all the fashion in Ukraine
Fluoridation: What a difference a year makes?
Wishart misrepresents fluoride science to advance his extreme ideology
Fluoridation: emotionally misrepresenting contamination
April ’14 – NZ blogs sitemeter ranking
Peer review, shonky journals and misrepresenting fluoride science
Ingested fluoride is beneficial to dental health.
Anti-fluoridation advertising deceptive
Fluoridation: putting chemical contamination in context
The first victim!
An outdated tax anomaly – charitable status of relgion
Declan Waugh scaremongers over fluoride – again
Arrogance of ignorance?
Pandering to anti-fluoridation campaigners
International cooperation in space serving humanity
Is anyone listening?
March ’14 – NZ blogs sitemeter ranking
Scientific cooperation despite political posturing
Fluoridation returns to Hamilton City.
European border changes over 5000 years
Dental fluorosis: badly misrepresented by FANNZ
What makes something right or wrong?
How do we know what is true?
Cherry-picking and ring-fencing the scientific literature
Fluoride and heart disease – another myth
Graphic information in science
Corporate backers of anti-fluoride movement lose in NZ High Court.
Terry Pratchett making sense
Fluoride and the 5 easy steps of a conspiracy theory
February ’14 – NZ blogs sitemeter ranking
Pseudoscience in your supermarket
Another god debate
Repeating bad science on fluoride
Truth about those science fairs
Quality and selection counts in fluoride research
The precautionary principle
How can scientists use social media?
Curiosity sees a familiar “evening star.”
The fluoride debate – what do the experts say?
January ’14 – NZ blogs sitemeter ranking
Entertainment is brain exercise
Download The Fluoride Debate
Determining scientific knowledge by petition
Fluoride debate: Final article – Ken Perrott
Fluoride debate: Paul Connett’s Closing statement
The good(?) old days of scientific writing
Most of us missed this one
False balance and straw clutching on fluoridation
Who is funding anti-fluoridation High Court action?
Astro-turfing for scientific credibility
Losing trust in religious leaders
Conspiracy theorists misuse analytical evidence
All things bright and beautiful
December ’13 – NZ blogs sitemeter ranking
Fluoride debate: Ken Perrott’s closing response to Paul Connett?
Putting vaccination risks into context
Fluoride debate: Arguments Against Fluoridation Thread. Part 8. Paul
Alan Turing receives royal pardon
The true meaning of Christmas
Where is the heat going?
Fluoride debate: Response to Paul’s 5th article
Back to the moon!
Fluoride debate: Arguments Against Fluoridation Thread. Part 5. Paul
Census 2013 – religious diversity
Fluoride debate: Response to Paul’s 6th article.
Testing the God theory
Fluoridation debate: Against Fluoridation Thread. Part 6.
November ’13 – NZ blogs sitemeter ranking
‘The particle at the end of the universe’ wins Winton Prize
Fluoridation debate: Why I support fluoridation – 2nd reply to Connett
Psychics have it easy these days
Fluoride Debate: Why I support fluoridation – 2nd response from Connett
From dental neglect to child abuse?
Fluoride Debate: Why I support fluoridation – response to Connett
Fluoride debate: Why I support fluoridation – Response from Connett
Word of wisdom, and otherwise
Have local climate pseudosceptics come to the end of the road?
Fluoride debate: Why I support fluoridation
Sin is relative
Fluoride debate – I get email
Fluoride debate Part 1a – response to Connet’s response: Perrott
Fluoride debate – some housekeeping
Fluoride debate Part 1a – response: Connett
October ’13 – NZ blogs sitemeter ranking
Fluoride debate Part 1: Perrott
Fluoride debate Part 1: Connett
The fluoride debate – introduction
The origins of ethics and violence
What’s really true?
Moral animals
Anti-fluoridation porkies – Mullinex’s rats
Science and faith
NZ climate change “sceptics” abandon appeal
Christianity has hijacked human values
Fluoridation: Hangout with the University of Waikato
The universe – it is bigger than you think
Our Far South – time we learned about it
Christian ethics and Peter Singer
Fluoride – friend or foe: a lecture
Cyber bullying of science
Fluoridation: the hip fracture deception
September ’13 – NZ blogs sitemeter ranking
Tim Minchin – an inspirational speech to graduates
Jon Stewart interviews Richard Dawkins
Anatomy of an anti-fluoridation myth
NZ experts deplore anti-fluoridation misrepresentation of science
Helping kids to wonder
Fluoridation – the IQ myth
When politicians and bureaucrats decide the science
Welcome counter to scientific and health misinformation
New “evidence” for global cooling?
Phobos eclipses the sun – as seen by Curiosity
Dentists you can trust?
Activists peddle chemical misinformation for fluoridation referenda
August ’13 – NZ blogs sitemeter ranking
Cherry picking fluoridation data
Anti-fluoridationist astro-turfing and media manipulation
Anti-fluoride activists attempt to silence science
Crazy ideas and “supernatural” phenomena
Experts speak out on fluoridation
Fluoride sensitivity – all in the mind?
Earthquakes and twitter
Cyber-bullying – what’s with sunscreen?
Anti-fluoridation study flawed – petition rejected
News media influences public trust in science
The “consensus message” in communicating science
Hamilton – the water is the problem, not the fluoride!
Topical confusion persists
Celebrate your curiosity – one year on
July ’13 – NZ blogs sitemeter ranking
Is this the way to reorganise science?
The limits of science and a world record
Water treatment chemicals – why pick on fluoride?
Are you qualified to discuss God, Heaven and Hell?
The Galileo fallacy and denigration of scientific consensus
A new Cosmos
Michael Mann’s defamation lawsuit on track
Is fluoridated water a medicine?
Debunking anti-fluoridation myths
Source of moral authority has shifted
Fluoridation – an organised campaign to misinform.
Hamilton gets its fluoridation referendum
Not your usual rocket launch
Fluoridation – topical confusion
Communicating climate science – Michael Mann comments
Fluoridation and conspiracy theories
Richard Dawkins learns about the Bible
Fluoridation – the violation of rights argument.
June ’13 – NZ blogs sitemeter ranking
The victim mentality of conspiracy theorists
Poisoning the well with a caricature of science
Fluoridation petition – for Hamilton citizens
The importance of books for kids
Fluoridation – it does reduce tooth decay
Stop feeling guilty
Getting a grip on the science behind claims about fluoridation
Is fluoride an essential dietary mineral?
Will Hamiltonians finally get a voice on fluoridation?
Scientists, political activism and the scientific ethos
Fluoridation – are we dumping toxic metals into our water supplies?
When science is under attack
Tactics and common arguments of the anti-fluoridationists
Hamilton City Council reverses referendum fluoridation decision
Global warning in science fiction
May ’13 – NZ blogs sitemeter ranking
Peter Singer on effective charity
The science of consciousness
Collapse of Arctic sea ice
An eReader breakthrough?
Singing about the periodic table
Black cat in a dark room – and the role of science
A New Zealand climate change pseudosceptic apologises!
Pseudosceptics are at it again – misrepresenting and attacking climate scientists
Chris Hadfield’s 5-month Space Mission in 90 Seconds
Confusion and distortion – has global warming stopped?
“Incontrovertible” is it, Rodney?
Video coverage of astronauts’ return to earth next Tuesday morning
A beggar’s market?
Interfaith delusions
The limits of philosophy
April ’13 – NZ blogs sitemeter ranking
‘The Unbelievers’ and science
A global warming hoax meme is born – in New Zealand too!
Friday follies – what happened to the “official AGW hypothesis?”
Fiddling with census figures for religion in New Zealand
The beginning (of the universe) for beginners
Terrorism and the West’s obsession with oil
Marriage equality, retribution and moral progress
A sombre night in Boston
Moving into the mainstream – on the coat tails of the “New Atheists”
Thatcher, Monckton and Pinochet
Potty Peer in Waikato
New Zealand Blog ranking Montage
What is global temperature?
I was wrong about Lord Monckton
New “Hockey Stick” but same tired old denial
March ’13 – NZ blogs sitemeter ranking
April Fools and Agenda 21
Christchurch from space
A war between religion and science?
Climate contrarians/deniers are cherry picking again
Dishonesty of intelligent design “research”
Something for all those lapsed catholics
Dawkins’ new book
Our world from the International Space Station
Creationists prefer numerology to real scientific research
Don’t panic
Talking sense about morality
Extreme confirmation bias in action
Greedy Lying Bastards
Those arguments against marriage equality
Census 2013: That religion question
Climate change is not simple
February ’13 – NZ blogs sitemeter ranking
A sensible Christian perspective on Peter Singer
No immutable truths, no eternal dogmas
Global climate – and your grandchildren
Entertaining – and the science is good
The truth about the hockey stick
Origins of religious ethics and violence
Sean Faircloth, Director of Richard Dawkins Foundation, visiting NZ
The Russian meteor – what we know
Should we be prepared?
Does religion blur understanding of evolution?
The “dynamic duo” of science?
A day for cheap shots
Science as the best, possibly only, way to truth
The reality of cancer
Education should never validate ignorance
“Divine commands” and personal conscience
January ’13 – NZ blogs sitemeter ranking
Troll training
Is your region warming?
No cause for alarm – if you cherry pick
The political alarmism behind climate change denial
Can philosophers, or anyone, tell us what is “right” and “wrong”?
History of science – for Kiwis
What a shock!
Who is guilty of misusing science?
Deconstructing climate change, and its deniers
Amazing photos of Shuttle Endeavour flight deck
Australia’s “New Normal?”
Going beyond the evidence
A time for hypocrisy
Historians and sociologists just as human as scientists
December ’12 – NZ blogs sitemeter ranking
A problem with logic
Historians and sociologists lecture scientists – about science
Wonders of Life coming – we hope
A dose of reality
Pulling the wool over the eyes of the faithful
Scientists and philosophers discuss morality and meaning
Christmas present from NASA
At last – Moving Naturalism Forward videos
Getting the Book Invented
Sense on evolutionary psychology.
Does science have a cognitive privilege?
Sceptical humility and peer review in science
Cancer – an emotional rollercoaster
Sceptical arrogance and evolutionary psychology
And now for a bit of drama
Agreement polar ice sheets are melting
November ’12 – NZ blogs sitemeter ranking
Regarding women as animals
Christmas present for nerds – what about science books?
Time for philosophical honesty about Darwin
Religion in schools – a sensible approach
Climate change deniers don’t understand expertise
The arrogance of supernatural privilege
Morality and non-human animals
More damage from megastorm Sandy
Capturing kid’s minds with emotions
That particle again
Who were Stalin’s victims?
Reports from the Moving Naturalism Forward workshop
The elephant in the US elections
October ’12 – NZ blogs sitemeter ranking
Sex, Death And The Meaning Of Life. Episode 3: Meaning
Who are these “credible experts”?
The mini-iPad and original sin
Death – part 2 of a series
Beer, anxiety and depression – their origins
Why (some) Christians support discrimination
Sex, Death And The Meaning Of Life – Sin
Moving Naturalism Forward
A concise summary of climate change – science and politics
From evolution to belief
Are you offended yet?
This has to stop
Sneaking in the magic man
Naturalism and science are incompatible
None so blind
A Kiwi makes it to Mars!
September ’12 – NZ blogs sitemeter ranking
The most important place you didn’t know about
A useful map of the human body
The paradoxes of theological gullibility
The internet – Yeah, right!
US air traffic on a typical day and on September 11, 2001
Finish the sentence . . .
People saying stupid things on the Internet
Another anti-science attack on Mann fails – but the lies continue
Secularism – its internal problems
Politics and economics of Arctic ice loss
Internet silos become ideological ghettos
Climate change denier’s false “deep distress” fools no-one
Changing that light bulb while in denial
High Court ruled on integrity – not science
New Zealand climate change denial defeated
I don’t know!
Making giant flowers out of fireworks
Moral evolution in today’s society
August ’12 – NZ blogs sitemeter ranking
Drifting moral values
Subjective morality – not what it seems?
Objective or subjective laws and lawgivers
Neil Armstrong by Buz Aldrin
Nooooo!
The science philosophy “conflict”
Making sense of religion, science, and morality
Kiwi science fiction with a message
Science – the greatest story ever told
A sundial on Curiosity?
Scientific shift work
Cynical evangelisation of children
Therapeutic ranting
Infectious jubilation
Curiosity requires patience
Going for gold – on Mars
A load of science
July ’12 – NZ blogs sitemeter ranking
NZ Blog Rankings FAQ
So scientism = non-theism?
Saying it with flowers
What really happens in religious instruction classes?
What Is Life? From Schrödinger to Watson to Venter
Their mission – values or advancement of religion?
The story behind the High Court action
Ethical enquiry or moral instruction?
Scepticism, denial and the high court
William Lane Craig’s philosophy – the condensed version
So you think science has a problem?
Peter Singer on the misrepresentation of Peter Singer
Human values are secular
End of life decisions
Why the Higgsteria?
Cost of scientific research – and political naivity
The creationism controversy – a summary
Is there room for religion in science?
June ’12 – NZ blogs sitemeter ranking
Scientific knowledge should trump “belief”
Seven Minutes of Terror
Australian census confirms healthy trend
Science is messy – for girls too!
Print-on-demand books – what’s the hold-up?
How to write a best-seller!
Sharp increase in “nones”
A disciplined discussion
What did Galileo ever do to you?
Gnu bashing once again
The prejudiced journalist
Do atheists need religion?
Mixing values and Jesus in secular education
The Scamtific Method
May ’12 – NZ blogs sitemeter ranking
Scientific knowledge – reliable but not certain
Weather extremes and climate change
“Web monkeys” and science presentation
Dementia – There’s an app for that!
Give them enough rope . . .
Why won’t Inland Revenue subsidise my life expenses?
Human morality is evolving
So you’re considering switching to eBooks?
Welcome to the Anthropocene
Naturalism in science
“Lose” your faith, gain your life?
What’s in store for eBook readers
Heartland ignorant of public relations – let alone science
Belief and morality
What has science ever done for us?
April ’12 – NZ blogs sitemeter ranking
The problem with philosophy
Puddles and “fine-tuning”
Great science talks in Auckland
Science denial is a diversion from the real problems
When the “best explanation” is the worst explanation
Toss out the moderator for a better discussion
Jesus heals – but not cancer!
Emotional time for Shuttle fans
Catholic popes victims of sexual abuse!
Who is committing fraud here?
Morality and the “worship” of reason
The silliness of a self-proclaimed “investigative journalist”
Moral behavior in animals
Conservatives, liberals and purity
The trouble with physics?
Is God incredible – or what?
Science and the folly of faith
Quantum politics
March ’12 – NZ blogs sitemeter ranking
Another lousy photo of the sun?
The Sand Creatures
Reasonable truth?
A fuzzy photo of the sun
The “public square” myth
Yes, please try this at home!
Cascading books
Beyond Religion
Whanganui District Council comes to senses
“Good faith” science – and its enemies
Climate change controversy in context
Shy climate denier in “science team” reveals himself.
The chickens are hatching
February ’12 – NZ blogs sitemeter ranking
The size of things
Mindboggling
Theological pretzel twisting
Flying pigs
A universe in an eBook (or app)
Co-opting “Truth”
Souvenirs for scientists
Heartland Insitute gets mail
Heartland’s climategate – and Mann’s book
Bioluminescence in space!
Privileged whinging?
Defeat for imposed prayer
ID research and publications
Theological mental gymnastics over evolution
“What, me worry?” – distorting climate change data
Free will – problems of definition
January ’12 – NZ blogs sitemeter ranking
The scientific method – what about the philosophical method?
In the front lines of the “climate wars”
Who is funding the climate change denial groups?
Our fingerprints are all over it!
The [in]compatibility of science and religion
Comprehending reality – Should we give up so easily?
Nothing is something
Who drives the science/religion conflict?
Choosing your religion
Open letter across the barricade
New book formats
The argument from authority (or lack thereof)
December ’11 – NZ blogs sitemeter ranking
Peter Jackson – Satan’s Little Helper”
“Other ways of knowing” and their result.
Slaughtering some sacred seasonal cows
Reacting to a death with respect and hatred
Sabotaging science
Christmas present ideas: This Hell would be useful!
Higgs and homeopathy
Christmas gift ideas: Aussie wisdom
Christmas gift ideas: The human mind – a history
Christmas gift ideas: Evolution of gods, morals and violence
Christmas gift ideas: Working on Mars
Christmas gift ideas: One for the kids
Christmas gift ideas: Why we deny climate change
Christmas gift ideas: Thinking of our grandchildren
Christmas gift ideas: How We Know What’s Really True
Christmas gift ideas: Kids – it’s OK to be different!
A debunking handbook provides lessons in science communication
November ’11 – NZ blogs sitemeter ranking
Finding out about the astronomers who found the universe
Hypocritical gratitude?
Climategate 2.0 and “toecurling” journalism
It’s crowded up there
Moral strawmannery
Creative science writing
Royal Society’s science book of year Winton Prize winner.
Reclaiming ‘intelligent design’
A lesson in human logic
Is Keith Ward really that naive about science?
Fine-tuning fallacies
Demolishing Craig on morality
Cultural effect of The Big Bang Theory
Answer simple question – win an iPad
New Zealand in good company. Pity about the USA
Rational morality
October ’11 – NZ blogs sitemeter ranking
What’s your number?
Concern over William Lane Craig’s justification of biblical genocide
Outsourcing moral decisions to justify genocide
New Zealand happy – some preachers upset!
The never ending battle
Having it both ways
Ranking human conflicts and tyrannies
Dawkins responds to a stalker – Craig gets his debate
Avoiding possible catastrophe – even if you are confused
You CAN be good with God!
Big money behind local climate change deniers?
Historians of science sometimes miss the wood for the trees
Approaching morality scientifically
Ethicists have problems with ethics!
The climate change denial machine
How do you know that?
How We Know What’s Really True
Problems with pdf eBooks – metadata issues
September’11 – NZ blogs sitemeter ranking
Compulsory payments for advancement of religion – let’s get rid of that.
Some recent recommended science books
Art in science
Evolutionary cooperation
Where have we been?
Rings around Uranus
William Lane Craig’s “logic”
Science and the “supernatural”
Empathy for colleagues
Approaching a Middle East peace
Atheists aren’t shrill – just disgusting?
What’s this about cosmic rays and global warming?
Making life from the primordial soup
A fight-back – or simply spite?
Evolution and education – advice for teachers
That’s what I like to see in a young woman!
A reminder of reality’s magic
August ’11 – NZ blogs sitemeter ranking
Religious theology of secularism
Martydom of the priveliged
Another book for the kids
Secular democracy and its critics
2012 Global Atheist Convention – Melbourne
Hitler objects to atheist charge
440 FOI requests in one day! From one person!
There is something about Wellington
Some things for the kids
Congratulations PZ
The blinkered view of politics?
I get email
NZ blog rankings update
Is Monckton good value?
The reality of scientific research
Monckton messes own nest
July ’11 – NZ blogs sitemeter ranking
Videos on morality
Pat Churchland on the science of morality
Breivik’s terrorism and science
Terror in Norway
Atlantis returns home – viewed from ISS
Background Briefing for Mockton’s NZ visit
Science has the real debate
Bias in the history of science
Seven years of discovery
Your chance for a free book
That hacking scandal
Are scientists hostile to religion?
Galileo’s modern critics
Debates in the philosophy of science
Does science lead to secularism?
June ’11 – NZ blogs sitemeter ranking
Personal attacks on climate scientists
A silver lining to Expelled?
Historical fiction
Galileo’s revolutionary contribution
Science, religion and respect for meaning
Protecting yourself against bullshit
Clarifying some myths in the history of science
Early history of science
Converting beliefs to “truths”
Ideology and violence
Painless science writing
Philosophical sausages
May ’11 – NZ blogs sitemeter ranking
Waking from a coma!
American Imams supporting evolutionary science
A secular bible
Confronting accomodationism
Daniel Dennett on conflict between religion and science
Visible signs of the rapture
The Magic of Reality for young people
Don’t drink the punch!
Working on Mars
A non-theist feast down under!
The chances of Royal Weddings arising randomly…
Designer spin II
Designer spin
What’s special about religious “knowledge?”
Climate change lectures in Auckland
April ’11 – NZ blogs sitemeter ranking
Exposing the pretense of Christian unity
Is there a role for science in morality?
Philosophical justifications for morality
Answering questions on morality
Problems with philosophers and theologians
More on the science of morality
Selling the family silver!
Craig brings some clarity to morality?
Foundations of human morality.
Church rejects power of prayer!
Limits of logic
Celebrating Reason
Something to celebrate
Advocating or explaining secular moral values?
March ’11 – NZ blogs sitemeter ranking
What is Life? Another Great Debate
The Galileo myths
Beauty, mystery and science
Christianity gave birth to science – a myth?
The implausibility of reality
Is atheism bad for science?
Myths within a myth
Thank goodness for eBook Readers
Theistic science? No such thing
The ethics of exploitation
Blogging for New Zealand
Science Under Attack?
Acceptance of science – dangerous for some
Making sense of Ring gate?
February ’11 – NZ blogs sitemeter ranking
From “Grand Design” to “On Being”
A human response to Christchurch quake
Alan Turing documentary
Taking the census seriously
The future of books – and Santa?
On being philosophical about science
Political stupidity
The secular Egyptian protest a good start for a successful revolution
Shonky climate-change denial “science”
Reinterpretation “research” on climate change
A hymn for Darwin Day
Celebrating Alan Turing’s life and achievements
The scientific study of religion
January ’11 – NZ blogs sitemeter ranking
Converging evidence on climate change
eBook “singles” – and the problems
Marie Curie Lecture Series – 2011
Comparing blog visit statistics
Shoddy reporting on “god genes”
The god gene – or is it a meme?
Certainty is useless – a scientific concept
The nature of the science-religion conflict?
“Other ways of knowing” – some sense at last
Culture and the scientific renaissance
Sharing a chemical moment
The moon and the ISS
Secular News Daily – useful source
New views of eclipses
Overlapping Magisteria?
Deriving “ought from is” scientifically?
December ’10 – NZ blogs sitemeter ranking
Science and morality – a panel discussion
A physicist comments on science and morality
A philosopher comments on science and morality
Telling right from wrong – unreligiously
Another local climate change denial meme
Wine and the Watchtower
It’s that time of the year
A handy app for your iPhone, iPod touch or iPad
A philosopher’s Christmas present
Painted into a corner?
Real science – warts and all
WikiLeaks and climategate
2011 – International Year of Chemistry
Philosophical problems
Aussie wisdom
The “You Can’t Trust Science!” agenda
NASA and old lace
November ’10 – NZ blogs sitemeter ranking
Cutting off your nose for Christmas?
“Other ways of knowing” purpose?
What is the problem?
A victory for secular ethics
The Hitchens – Dembski debate
The joys of eBook readers – the Sony PRS-650 Touch
Secularism is important
Dawkins answers questions
Telling right from wrong?
Scientism
Can science shape human values?
Some book ideas
The ISS – a decade of growth
Materialism
October ’10 – NZ blogs sitemeter ranking
The human mind – a history
Check out those climate change claims on the internet
Waking up to morality
Four signs of a stroke
Can the “supernatural” be of any use?
Are ebooks taking off?
Some pesky delusions
Strident, militant atheists?
Why we deny climate change
Attitudes will change. Life will get better
Your computer is the enemy!
Death by stoning for adultery!
Scientific misconduct and skepticgate
Breaking away – an interesting case study
Sam Harris on The Daily Show
Chauvinistic ethics?
Move over – old fellow!
Hawking’s grand design – lessons for apologists?
Arrested moral development.
September ’10 – NZ blogs sitemeter ranking
Treating statistics sensibly
Not about Einstein
Bus adverts a human rights issue
Check out your ancestors
Trust the experts – if they say what we want
The Bible – a book review
A scientific consensus on human morality
Pope Benny’s speech – graphically
Putting the Pope in his place
Popes cunning straw mannery?
Human Evolution and the Organ of Mind
Mind change – a moral choice?
Putting the IPCC in its place?
Mapping modern science
An unnecessary being?
What is matter? What is materialism?
New science blogs in New Zealand
The Grand Design – neither God nor 42
Earth and Moon from Mercury
The Challenge of the Human Brain
August ’10 – NZ blogs sitemeter ranking
Fallout from Hauser affair spreads
A lesson for NZ critics of climate science?
Nicholas Stern to present Robb Lectures
So you want a conversation?
The myth of the noble scientist
The heart of PZ Myers
After NIWA, God?
Marc Hauser replies – acknowledges mistakes
Hauser misconduct investigation – Full text of Dean’s statement
Fallacy of Fine Tuning
A desperate plea to be noticed?
A stormy future?
A sympathetic take on Marc Hauser and the “scientific misconduct” issue
A paper by Marc Hauser retracted – Harvard Magazine
Climate change is complex
A nice little tool for printing blog posts
“God of the surprises”
Recognising good science bloggers and Big Blog Theory winners
It’s politics, not science
July ’10 – NZ blogs sitemeter ranking
Suzan does a mini- Monckton
Evolution of gods, morals and violence
Is and ought
The new science of morality
Science, faith and limits of knowledge
Liability of scientific denialism to political conservativism
Evolution and the Holocaust
Life on the building site
Theological critiques of billboards required
Support John Abraham against Monckton’s bullying
Ways of not knowing
The changing face of science communication
A regular climate science podcast
Climategate – Journalist withdraws and apologises
Making room for faith in science?
Getting straight on marriage
“Climategate” smears found false – Mann cleared
NZ Atheists Swap Buses For Billboards
June ’10 – NZ blogs sitemeter ranking
Religion in public life – two approaches
Ridiculing ridiculous science commentary
Truth getting it’s boots on!
A question of expertise and credibility
Climate scientist’s’ register?
Kids – it’s OK to be different!
Twinning with Venus
Avoiding grown-up discussion
A competition for Aussie science blogs
Apologies would be nice
Alarmist con
Historic shuttle launch photos
Australians concerned about tax exemption for cults
Pseudoscience and anti-science nonsense
Science on New Zealand TV
Hot science blogs
May ’10 – NZ blogs sitemeter ranking
Journalists create world’s first artificial news story!
Don’t trust Monckton!
This is scary!
Theological intrusions into science
God, stop ‘playing science’
Why Don’t We Go To Church?
Sneaky scientists
The heart of opposition to climate science
Last chance – almost!
What’s that about global cooling?
Are you threatened by clarity?
Supporting good science communication
We don’t know!
Monckton and Shimkus get silly together
The Dawkins Delusions
Climate change and the integrity of science
Secularism in Australia and New Zealand
Natural selection or domestication?
April ‘10 – NZ blogs sitemeter ranking
Thinking of our grandchildren
Science, values and ethics
Avoiding tax – supernaturally
Climate scientist sues newspaper for false reporting
Climategate, Lord Monckton and Monty Python
Climate change deniers wallets threatened
Climategate summed up
Superstition – inevitable?
Libel Reform campaign continues
RIP Antony Flew
Officially a fake scandal from science perspective
Dangerous science denial
Arresting comedy
You have to laugh!
A more transparent approach
Orbital debris, the ISS, moon and sun
A space nerd’s Easter
Getting to the truth – gradually
March ‘10 – NZ blogs sitemeter ranking
Climate scientist Phil Jones exonerated
The origins of science?
The rickety bandwagon of climate change denial
Are religious scientists worried about their brethren?
The climate change denial industry
Can science answer moral questions?
Periodic Table of of science blogs
Creationism, climate change and scientific denialism
Open Letter from U.S. Scientists on the IPCC
From Melbourne to Copenhagen
Are science and religion compatible?
Swiftboating science
Chris Mooney interviews Michael Mann on “climategate”
Science bloggers talk teaching
Great photo of the Solar Corona
Clear science communication
Institute of Physics in hot seat
Realising secularism
Climate science for you and me
February ’10 – NZ blogs sitemeter ranking
Richard Dawkins – wrong again!
Freedom of information and responsibility
This game looks familiar
Anti-science lies being exposed – slowly
Deniers distort Phil Jones
Faith schools
New Zealand has bigots too
Belief and social identity
Etiquette for the office global warming denier
NZ blogs sitemeter ranking – February ‘10
Climate change confusion – a conspiracy of sorts
WARNING! People might find us out!
One for the kids
Get your climate change science on the run
Can science solve all problems?
Spinning exoneration of Dr. Michael Mann Into “Whitewash”
Self-exposure – a journalist out of depth
A photographer’s dream
Get in line – who is the odd one out?
I want one of these!
The ISSS used for teaching
Overdosing on water
Ideological infections
Car pool, string theory and human genetic history
CO2 emissions, birth & death rates by country, simulated real-time
I thought the award for mistakes was mine!
Atheists provoke a reaction
Climate change deniers’ tawdry manipulation of “hockey sticks”
Journeys to the Ice – New SciBlogsNZ blogger
Martin Luther King’s dream
NZ blogs sitemeter ranking – January ‘10
Monckton requires religious certification for scientists?
No gods required
Secular charity
Lynch mob mentality
“Blithering idiocy”
Understanding the “multiverse”
A good climate change book
Beware the retired scientist?
Philosophers aren’t so bad!
NZ blog ranking – RSS subscriptions 2009
The dogma of paradigm shifts
Overcoming dogmatism in science
The “supernatural” and dogmatism in science
Scientific method and the “supernatural”
Belief, knowledge and science
The Unconsidered Life
“A plot to rule the world”
George Monbiot on ClimateGate & the climate denial industry
Testimony of non-believers
Becoming an atheist
The global warming debate summarised
Justifying child abuse
Sack all those scientists? yeah, right!
NZ Atheist Bus Campaign reaches fund raising target in under a week
NZ blogs sitemeter ranking – December ‘09
Bus adverts and the 2011 NZ census
Are they sceptics or deniers?
New Zealand’s denier-gate
Environmental movement needs pragmatism
The global warming conspiracy?
New Zealand’s climate change deniers’ distortions exposed.
Remove support for child abuse
Deniers in denial over climate information
Richard Dawkins in Auckland – update
Being good – no gods required
Peer review – an emotional roller coaster
Climate change deniers live in glass buildings
Richard Dawkins in Auckland next March
“Climategate” – the smoking gun?
Appropriate thanks
Awesome pictures from the Enceladus flyby
Those “climategate” emails
An Introduction to Evolution
NZ blogs sitemeter ranking – November ‘09
Galileo and Hollywood
Distorting Darwin
The rules of science
Twittering in space
Morality – from the heavens or nature?
This Hell would be useful!
Einstein on Galileo’s contribution
Why Evolution Is True
Richard Dawkins in Wellington next March
The clash of science and politics
RIP – Theo van Gogh
Promoting confusion
Judging the internet – and books
A Universe From Nothing
Defending science and reason
NZ blogs sitemeter ranking – October ‘09
The Galileo Lectures
Lamenting loss of funerals
Empathy’s origins
Galileo, Darwin and the new enlightenment
New bird designed!
BCA libels Simon Singh?
A victory for Simon Singh
The Earth and Moon – from Mars
Why We Are Atheists
Books in prisons
It’s all in the brain
Battle of the bus ads
Godless cosmology
Stars, earth and water
Humanity’s most important image
NZ’s largest science blog network goes live
Sustainability and ethics
NZ blogs sitemeter ranking – September ’09
The naked emperor
From the keyboards of scientists…
Depressed? Anxious? Aren’t we all?
Saving the planet with condoms
Get in the sack!
Theistic evolution?
Charles Darwin – Art & science
Metaphysically speaking
Look out!
Evolution of human morality
Science communication in New Zealand
“We’re sorry: you deserved so much better”
New Hubble images
Surly theism
Chemistry for kids
The philosophy wars
Bright future for books
Brian Greene’s big idea
Global warming is real – climatologists
Behe’s “objectionable” interview reinstated
NZ blog ranks – August ’09
Carl Sagan’s challenge ignored
Awesome!
Behe’s “objectionable” interview
Religion in the public square
NZ scientists twittering
Biocentrism or eccentrism?
Dawkins bashing season upon us?
That ‘no’ vote
NZ blogs sitemeter ranking – August ’09
The Big Bang Theory and sexism?
NZ science bloggers – new opportunity
Evidence, not lawyers
Book recommendations?
Social networking for scientists
From stones to atoms
Disputing respectfully?
Theistic mental gymnastics
“Smacking not an offence”
NZ blog ranks – July ’09
“Knowledge” from ignorance
“Historical science”
Beware the Spinal Trap
The Atheist Camel Chronicles
Scientific controversies?
That referendum
Atrocious Science Clichés
Killing off Darwin?
Bible a favourite for atheists!
Apollo 11
Epistemolo-what?!!
Logical atheism
Science-religion conflicts. Who’s responsible?
NZ blog sitemeter ranking – June ‘09
Different ways of knowing?
Quantum Gods
This much I know
The facts of evolution – and jealousy
NZ blog ranks – June ’09
The entropy fib
Don’t encourage them!
Wave goodbye to email?
Iran’s problem
Do you believe in a god?
NZ Evolution Survey
The purpose of purpose
Kiwi Science Blogging
A NZ blog ranking tool
Charity and linked data
Suppressing science
The Bain illusion
Boycott Coke
Element 112
Purpose
Transitional fossils
Morality and politics
NZ blog sitemeter ranking – May ’09
That’s telling them
Unintentional arrogance
Beyond the shouting
NZ entries in science blog awards
NZ Blog ranks – May ‘09
Subscription & email updates
Hand of God
Science blogging prize
Scientific laptop fashion?
Pimping Ida
Public hearing for Salinger case
Agnostic/atheist labels
Poles Apart – wrong process, right conclusion?
The greatest show
Religious moral relativism – another example
Richard Dawkins in Auckland
Human Morality V: The secular conscience
Ranking NZ blogs with sitemeter data
Human Morality IV: Role of religion
Good luck Jim
Human Morality III: Moral intuition
Human Morality II: Objective morality
Defining natural and supernatural
Human Morality I: Religious confusion
Whether we like it or not
Answering the big questions
Do whatever it takes…
Another chance to ignore our true religious diversity
The necessity of science
Why is science important?
Clamping down on science communication
NZ Blog ranks – April ’09
NZ Bloggers Badge
Middle east conflict in the NZ blogosphere?
PZ needs an iPod
Where is Galileo?
Belief not the same as truth
With God, anything can be permitted?
Where did we come from?
Hitchens in the lions’ den
How bacteria communicate
Scientific laws and theories
Blaming the victim
For Christian readers
Easter
Moral leadership on stem cells?
Dawkins on the Big Screen
Destroying mystery?
Different ways of understanding?
Blog traffic to aim for?
Police ignore non-religious
NZ blog ranks – March ’09
Ranking methods for NZ blogs
Saturn opposes Uranus
New Zealand popular science books
Babies and bathwater
Ayaan Hirsi Ali on the Viability of Hope
Out of touch with reality
Stalinist behaviour at creationist blogs
“Scientific” debate on the internet
“Interfaith” blindness
Intelligent design science publication policy?
Scientific investigation of morality
Creationism’s tactical blunders
Planning ahead
Hidden religious agendas
Scientific “authority”
Intelligible design
Rating NZ blogs
Meditating on one’s own beliefs
How we all subsidise creationists
Theme testing – feedback welcome
Beware of science!
Only 25% of Americans oppose evolution
Pinker on morality
Cosmological cranes – not skyhooks
Darwin Is The 1000th Steve!
Human genetic history
Darwin, art and entanglement
The Lotto “miracle”
Psychological abuse of children
Mass atrocities require idealism
78% of Britons support Darwin?
Dawkins to appear at Auckland Writers & Readers Festival lineup
Bad science, bad theology
The Antony Flew controversy
Science and democracy
Darwin Week discussion topic?
We are “fine-tuned”
International Year of Astronomy
Science & Islam – doubt
My favourite podcasts
Neurons and free will
Science & Islam
Bafflegab
Collectors’ items?
Fiddling with “fine-tuning”
The ghetto of apologetics “science”
Missing fossils? From water to land
Carl Sagan’s search for God
A rational universe?
“Scientism” in the eyes of the beholder
The dogma of “paradigms”
Dogmatism of the “supernatural”
The wedge undermines Christianity
Psychological abuse
Another extinction?
IPCC “bureaucrats”?
Fine tuning of the universe?
“Cosmic religion”
Dissent from science
No God? No Worries -Yeah right
Ex-Muslims speak out
Comment policy in flux
Universal Declaration of Human Rights
What is your purpose in life?
The immorality of conspiracy theories
Thoughts after watching “Expelled”
Denial not acceptable
Atheists not allowed to criticise Hitler!
Scientific prejudice?
Thanking those who deserve thanks
Society’s fear of science
Lysenko and the creationists
Prostituting science
Being good for goodness’ sake
Global warming misrepresentations
The alternative to science?
A tale of two elections
Introducing SkepticBlog
Climate change: the science – public disconnect
Einstein’s god
Climbing into Dawkins’ boots
A naturalistic approach to human morality
Candles in the dark
“Probably” no God – probably acceptable
Belief – a curse?
Let’s celebrate!
Introducing humanism into politics
The materialist label
Weaving a web of lies
Defining oneself negatively
What a view!
The Archbishop’s straw man
Thanks
Demolishing the icons of intelligent design
Using philosophy
Science in popular culture
The Bible’s place in politics?
Lying to children
Is New Zealand ripe for science blogging?
Dawkins’ prayer for his daughter
The atheist label
Trusting science
Let’s count teeth
Our secular heritage presentations
New Zealand Skeptics conference
Attacks on freedom of expression go international
Secularism is good for religion
Where do our morals come from?
Redefining science by inference
A critique of the ‘Theory of Childhood’
Does religion threaten human rights?
A new science-bashing campaign?
Reading in retirement
“It’s a miracle!”
What is the Large Hadron Collider?
What is theistic evolution?
Embarrased by Darwin
Religious belief and age
Design – it’s everywhere
Reminder – Secular NZ and Australia
Darwin lectures in New Zealand
Is New Zealand a Christian nation?
An optimistic future for energy storage?
Fueling a new cold war
Why the “new atheism”?
Evidence should trump “legal muscle”
Being politically correct about Mars
Top 100 Cutting-Edge Science Blogs
Science blogging in New Zealand
Darwin’s theory – or “Finding Nemo”
Our secular heritage & its future
Climate change optimism
Mystical atheism!
Spreading doubt on climate change
Help from your enemies?
Allan Wilson: Evolutionary
“Biblically correct” child abuse?
Wordle
Interfaith dialogue and human rights
Does intelligent design make testable predictions?
Climate change and New Zealand
Domestic violence
Is ID getting anywhere?
Intelligent design as a scientific idea.
Are ceremonies important to religions?
Send this DVD to our schools
Prayer refusal leads to discipline
Religious labels
I didn’t come from a monkey!
Most Americans do accept evolution
Culture wars come to New Zealand
Dogmatic falsification of science
Paradigms and dogma in science
Isn’t God convenient?
Demonising science
Dogmatism around science – the “supernatural.”
Scientific knowledge – not “just a belief!”
Holy war!
Evolution of New Zealand
Remarriage not an option
“Coming out” for evolution
Compassion
Climate change controversy
Appealing to spirits
Dembski, peer review and supernova
Teaching science in faith schools
Let’s ban cluster bombs
Improving performance of your brain
Phoenix has landed!
Do you believe in God?
Secular twins
Exploiting the vulnerable
Good luck Phoenix!
Driving the wedge into Christianity
Auras
Dissent from Darwinism list – further analysis
Evolution – a theory or a fact?
Lets say the sun is pulled around the earth by horse-drawn chariots
Helpful applications for blogging
Darwinism and that dreaded E-word
Judgement & compassion
Is “Expelled” successful?
Psychological and religious abuse of children
Non religious in Australia and New Zealand
Lawrence Krauss – Richard Dawkins discussion
Exercising your brain – physically
Humanist and anti-human trends in modern religion
The Pope visits New York
Expelled for supporting evolutionary science
The Darwinian behaviour of creationists
Richard Dawkins in Inverness
Expelled – no integrity exhibited
Expelled Bingo
Freedom of expression and human rights
Slandering science
Losing one’s faith
Interfaith dialogue to fight against human rights
The real climate change swindle?
Religious education should include secular humanism
Moral viagra
So what does Dawkins think of “Expelled”?
Should Dawkins have been Expelled?
Arthur C. Clarke dies
Intelligent design/creationism and climate change
Exercising your brain
Expelled – the movies
Freedom of expression and offence – religious or otherwise
Dishonest debating
Einstein’s “Cosmic Religion”
Fine tuning argument
Facing up to child abuse
Ayaan Hirsi Ali to get EU protection
The future of religion
Putting the Bible in its place
Intelligent design and depression
Beyond Tolerance – Toward Understanding and Respect
Replacing public prayers
Taxation offense
Obama on religion
Scientific dissent from . . . science?
A respectable man with a dangerous theory
Life: a gene-centric view
From faith to hatred
Arguments against atheist morality
New atheists or new anti-dogmatists?
Secular alternatives to religious communities
Moral authority
New Secular Philosophy blog
Religion and the “New Atheists”
Gaza: Stop Blockade and War
Who are the “dissenters from Darwinism”?
Changing your mind
Dissenters from Darwinism in context
Heresy, or common sense?
Religious opposition to “intelligent design”
Intelligent design and the threat to Christianity
Secular believers
Intelligent design and scientific method
Religious diversity and human rights
Dealing with Dawkins
Can religion answer the questions science can’t?
My own miracle?
Religious attitudes to knowledge
Holiday reading
Christian problems with morality
Carl Sagan
How to lower taxes
Atheism and religious diversity IV: Values, morality and spirituality
Atheism and religious diversity III: Conflict between science and religion
Atheism and religious diversity II: A personal perspective
Atheism and religious diversity I: Diversity in New Zealand
Bringing the supernatural into science
Secular Islam
Hoping for justice
Does science involve faith?
Losing faith, gaining humility
Giving thanks
For the glory of God
Faith – against all evidence
Intelligent design – a war on science
Dawkins responds to his critics
Moons of Saturn
Now I’m to blame for Stalin!
Human rights for the non-religious
A value in religious mysticism
From superstition to religion
Concorde religion
Darwin descendent at AAI Convention
From faith to reason
Delusions about Dawkins
God’s not as popular as we thought
Using your brain
Neuron bombs in Pakistan
New Zealand supports evolution
Why do we believe?
Lies and misinformation
Thank God or Thank Goodness?
Sources of evil?
Problems with atheism?
Intelligent design at the shopping mall
Society’s ” Christian values”
The Atheist Blogroll
Stand with Burma petition
Most ideas in science are wrong!
Morals, values and the limits of science
Coming under the influence
Intelligent design attacks on Christianity
Discrimination at school
The “New Christians”
My senior moment!
Isaac Newton and intelligent design
Agnostics – what do they stand for?
Religion and violence
Is religion the source of morality?
Theology of the Emperor’s New Clothes
Family planning and the inhumanity of religion
Art and the limits of science
Atheism and religious diversity
Evolution’s threat to religion?
The atheist wars?
The Enemies of Reason
Science and the supernatural
Religion and Schools
Limits of science, limits of religion
Humility of science and the arrogance of religion
Richard Dawkins and the enemies of reason
What do we teach our children?
The Trouble with Islam
Crimes of Communism and Christianity
Intelligent design/creationism: Postscript
Intelligent design/creationism IV: The religion – science conflict
Intelligent design/creationism III: The religious agenda
Intelligent design/creationism II: Is it scientific?
Intelligent design/creationism I: What is scientific knowledge?
Religion and children
Religion and morality
Anti-slavery petition
Questions science cannot answer?
Do religious leaders believe their religion?
Debating science and religion
Do you believe your religion?
“Let There Be Brights”
What is religion?
Solution to climate change?
Faith and terrorism
“Let us pray . . . “
♦ Would we recognise the second coming?
Tagged
♦ “I’m an atheist, but ……”
♦ Returning to the “dark ages”?
♦ Putting Dawkins in his place
♦ Overcoming religious problems
♦ A national anthem recognising diversity?
♦ International Atheist Convention
♦ Dalai Lama visit
♦ Limits of science or religious “fog”?
♦ Limits to respect and toleration
♦ Special rights for religion?
♦ Common values, common action?
♦ Atheist book sales overtake Christian books
♦ Can science enrich faith?
♦ Miracles and the supernatural?
♦ Christian prayer problems
♦ Atheist Blogroll
♦ Teaching religion
¶ Helen Clark’s diplomacy
¶ Blogs discussing religious diversity
¶ Destiny of Christian privilege?
¶ Trends in religious belief in New Zealand
¶ Religious diversity includes “non-believers”
¶ Science, art & pumpkins
¶ Religious Diversity Statement
¶ Should we teach creationism?

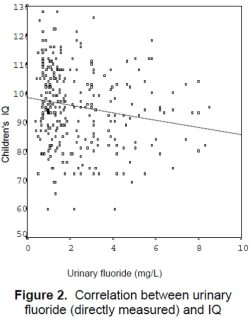 Despite being statistically significant (p=0.003) this is certainly not evidence for a causative relationship. Clearly other, unconsidered, factors contribute to the variance and if these were considered the relationship with fluoride may be non-significant.
 Connett and Hirzy effectively ignore the high variability in the data and rely on a trick to get this second graph. By splitting the concentration range into groups and taking the mean IQ for each group they make the situation look a lot more respectable. Who would guess from this trick that fluoride only explained about 3% of the IQ variance?
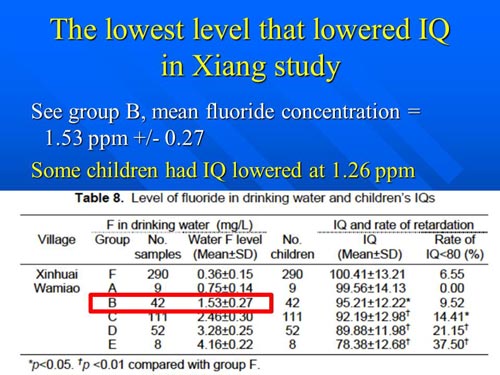
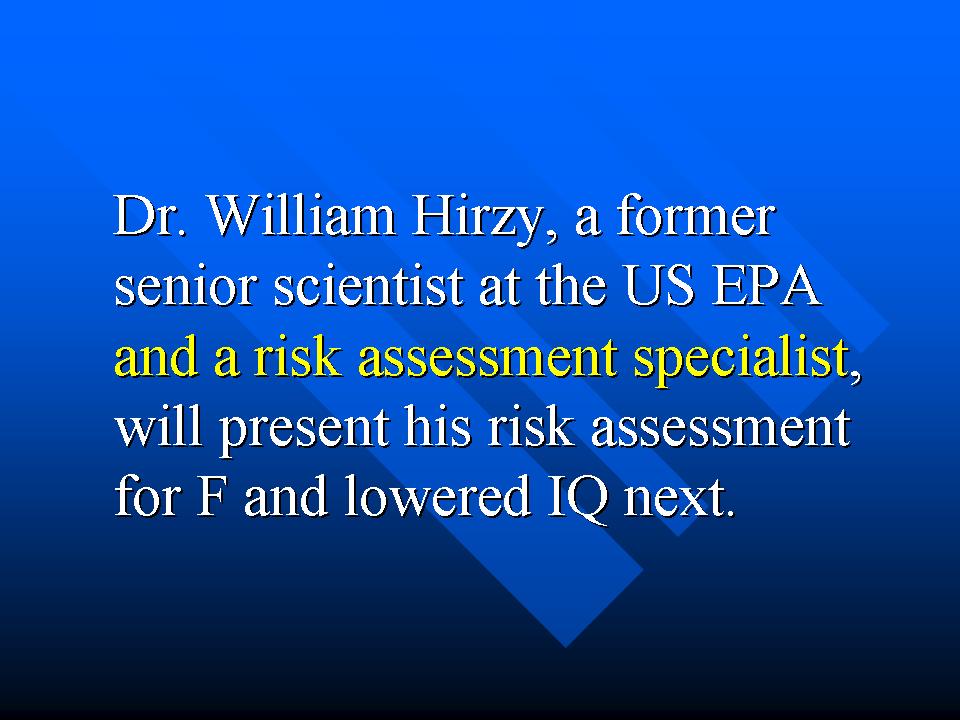 Connett goes on to promise his offsider, Bill Hirzy, will elaborate on the method they issued. Hirzy’s presentation did mention fluoride intake from other sources besides water. He then presents his conclusion on what the “safe daily dose” is fluoride – but no explanation of why! All the preceding slides in his presentation where self-justifying descriptions of his qualifications, employment history and how great his organisation, FAN, is.


Ken, fluoride is cleared from the blood by being sent to the bones or the urine or other organs, teeth included.
Greater intake correlating to greater urinary excretion is only part of the picture.
I ask if you know of any data for which the subset of people with dental fluorosis and their degree of that can be checked against urinary fluoride within the subset.. I am hypothesising that they are not so good at urinary excretion of fluoride.
For the people who do not have dental fluorosis I hypothesise that they will have a stronger correlation of drinking water fluoride to urinary fluoride. For the subgroup with fluorosis possibly they have a lesser correlation of fluorosis to urinary fluoride within their subgroup.
Then that subgroup can be checked for fluorosis – IQ correlation. Look at the part of the graph for this subgroup before the fluorosis gets to the stage where you want to claim appearance may be causing any IQ effect.
Brian Sandle
LikeLike
Brian, I do not “want to claim” anything. That would be confirmation bias.
But WTF has this to do with my post which is about the shonky methods used by Hirzy and Connett?
Or are you in avoidance mode again?
>
LikeLike
You’ve got a nerve Ken to call the work of Professor Connett and Bill Hirzy ‘shonky’ when the original ‘experiment’ that promoted fluoridation in New Zealand was a fraud . . . I notice you have resorted to the ‘f’ word so I guess you are getting quite rattled by the fact that more and more people are listening to people such as Hirzy and Connett and the voice of others now departed such as Dr John Colquohoun still live on . . . the truth will triumph . . . :}
LikeLike
Connett…..you gotta love him. When science has the audacity to not conform to his viewpoint, no problem……he just fabricates his own.
Steven D. Slott, DDS
LikeLiked by 1 person
So, Greenbuzzer, I will take it that you actually cannot fault my critique of the Connett & Hrizy approach as you are trying to divert?
But, if this is their approach it will be difficult for them to get past a genuine peer review process. So perhaps they will just publish in the captured journal “Fluoride” – which will be an acknowledgment of their ant-science approach.
Of course, if I am wrong then Connett or Hirzy could reply here – they know I am open to good scientific discussion.
>
LikeLike
Steven Slott – You seem to see fabrication in everything that questions the evidence on which community water fluoridation is founded. Given the calibre of many of those opposed to the practise and the fact they are not beholden to industrial entities with vested interests there is a distinct probability they might be right and you and your fellow zealots are wrong. I realise that must be a horrific outcome to contemplate but history is replete with examples of such events happening. Indeed you recognise that with your comment; ” When science has the audacity to not conform to his viewpoint, no problem……he just fabricates his own”.
I suggest you consider that statement and ask whether it may apply to yourself or are you stuck in the 1940s?
LikeLike
Trevor, science is evidence-based. It is not unsubstantiated personal opinion-based. Unlike you, I can provide valid facts and evidence to support my claims. Should you ever understand the importance of this, and get to that point yourself, you may have something of intelligence to add to a fluoridation discussion. Until then, you don’t.
Steven D. Slott, DDS
LikeLike
Given the calibre of many of those opposed to the practise and the fact they are not beholden to industrial entities with vested interests there is a distinct probability they might be right and you and your fellow zealots are wrong.
Unpack that ^ and you will understand how Trevor sees the world: It’s a conspiracy!
Drill down far enough and all science deniers fall back on the Konspiracy explanation.
LikeLike
Trevor Crosbie wrote Steven Slott – You seem to see fabrication in everything that questions the evidence …blah blah….
From one who claims 70 years of scientific research and consensus is fabricated.
Oh the irony, is it hilarious or tragic?
LikeLike
Ken: “But WTF has this to do with my post which is about the shonky methods used by Hirzy and Connett?
Or are you in avoidance mode again? ”
” By splitting the concentration range into groups and taking the mean IQ for each group they make the situation look a lot more respectable. Who would guess from this trick that fluoride only explained about 3% of the IQ variance?”
To rise cakes bakers use several things. Sodium bicarbonate releases carbon dioxide when heated. Baking powder combines sodium bicarbonate with an acid like tartaric, and that starts the release when moisture is present. Sometimes a bit of baking powder and some sodium bicarbonate may used in the same scones or whatever.
Or some tartaric acid may be added with the bicarbonate.
Say a scientist knows nothing of what is happening and is given ingredients and measures rise. This can be complicated by how long the mixture is left sitting before baking. Baking powder CO2 starts evolving straight away and may escape before before the scone structure gets set by heat.
Rise will be found to relate to the various unknown ingredents. It will relate to the acid over the *range* before the point at which all the bicarbonate is used up.
I don’t quite understand the ranges you refer to yet, but it seems to me that anything having a result in a range could have meaning.
So I referred to subgroups. I think you are too hasty to write that off as off-topic.
Unlike baking where we know most of the mechanism we do not know what is going on with IQ. What happens in ranges or between ranges might give us hints.
Brian Sandle
LikeLike
“I don’t quite understand the ranges you refer to yet, but it seems to me that anything having a result in a range could have meaning.”
So Brian, you are babbling again. The least you could do is read the post and get an understanding of the trick pulled by Connett and Hirzy
LikeLike
“Connett’s approach is a desk study – these guys are not going to dirty their hands by doing their own research to get useful data.”
Since the flavour of the moment is discussing “offense,” is that intended as offense, or what, Ken?
LikeLike
“Clean hands people”: https://chemistry.princeton.edu/theoretical
LikeLike
“That is strange because surely the first figure indicates that low IQ values occur even for children with very low urinary fluoride, and most probably drinking water fluoride.”
So do high IQ values. But the middle is shifting down.
LikeLike
“getting the hands dirty”, could be just a way of banter between theoreticians and practical scientists. Or Ken could even just be saying this is not new experimental work. But theoretical scientists can spend their lives applying maths and interpretation to others’ work and so making more use of the data which was costly to get.
What is offensive is sometimes because of how the receiver sees it than what was intended.
“Connett then uses a safety factor of 10 (“to account for the wide range of sensitivity expected for any toxic substance in a large population”). Of course, this produces a maximum “safe” concentration of 0.13 ppm – which rules out all fluoridated water – and most natural water sources!”
Same as some people can tolerate very little natural sunlight and some not even even strong light.
A factor of 10 can be standard practice in toxicology. If that cannot be achieved some people may have to be moved away or otherwise protected.
With radioactivity the safety limit is different for workers from what it is for the general population, which probably applies with other harming agents.
LikeLike
“By splitting the concentration range into groups and taking the mean IQ for each group they make the situation look a lot more respectable. Who would guess from this trick that fluoride only explained about 3% of the IQ variance?”
How are you getting 3% Ken? I presume somewhere there is a correlation of about 0.17? Where, if you might speed up my search, please?
LikeLike