

Anti-fluoride activists are rubbing their hands in glee over what they claim is “yet another study” showing fluoride harms the brains of children. But their promotion relies on IQ relationships which the paper’s authors acknowledge disappearing when outliers or other factors are considered. And they completely ignore other relationships which indicate much larger effects and are not influenced by outliers or other factors.
Why ignore this gift from the paper? I can only conclude these anti-fluoride campaigners don’t actually read the papers they promote.
Mind you, the paper is rather confusing. But the data, relating to formula-fed infants, is hardly surprising. It’s from the same group that has produced multiple studies along the same line – and suffers from the same weakness the other studies do.
The paper citation is:
Till, C., Green, R., Flora, D., Hornung, R., Martinez-mier, E. A., Blazer, M., … Lanphear, B. (2020). Fluoride exposure from infant formula and child IQ in a Canadian birth cohort. Environment International, 134(September 2019), 105315.
Multiple parameters measured
This research group appears to be taking the approach of searching existing databases using multiple parameters – in the hope of finding significant differences or trends. And then interpreting significant trends as evidence for a cause.
The problem is that the p-value, used to judge significance, gets pretty meaningless when multiple attempts are made on the same data like this, although there are statistical procedures for correcting the final p-values to get a more meaningful measure. But, more importantly, p-values are pretty meaningless even at the best of times – remember correlation is not evidence for causation and should never be used that way.

Don’t be fooled by a statistically significant relationship. Low p-values, even high R-squared values should not be used as evidence of causation. Data from Spurious Correlations.
The parameters used in this paper are full-scale IQ (FSIQ) verbal IQ (VIQ), performance IQ (PIQ) for the cognitive parameters. Fluoridation, water fluoride concentration and estimated fluoride intake were used as the fluoride parameters.
Looks very much like they were “spreading their bets” by using a range of parameters.
Difference between breast-fed and formula-fed infants
The difference they reported between breastfed (BF) and formula-fed infants are unsurprising. These differences were only significant for maternal education, HOME total score (a measure of the child’s home environment), full-scale IQ (FSIQ), verbal IQ (VIQ), water fluoride concentration and estimated fluoride intake. Parental attitudes to breastfeeding are probably expected to change with education. Breast-feeding has previously been reported to result in children with higher IQs and, however poor the F intake estimate, it would obviously be higher where the water is fluoridated.
IQ difference between fluoridated and unfluoridated areas
The data extracted from the paper’s Table 1 also shows that the VIQ of breastfed children is statistically higher in fluoridated areas. and the PIQ of formula-fed children is statistically higher in non-fluoridated areas. There were no statistically significant differences in FSIQ between children in fluoridated and unfluoridated areas irrespective of the feeding method.
 So, just using the mean values of the cognitive measures there were no statistically significant effects of fluoridation of FSIQ, VIQ for formula-fed children and PIQ for breastfed children.
However, child VIQ was greater in fluoridated areas for breastfed children and lower in fluoridated areas for formula-fed children.
Digging difference out of trends
The authors repeat the same method they used in Green et al., (2019) where although mean values showed no effects of fluoridation they used trends from linear regressions to imply there were effects (see If at first you don’t succeed . . . statistical manipulation might help).
In all their promotion of the paper, the anti-fluoride campaigners refer only to the data for FSIQ – the figures they cite make clear that their term IQ is referring solely to FSIQ. This is strange as the story is very poor for FSIQ and I would have thought they would concentrate on PIQ where effects are larger and not influenced by others or other factors as FSIQ is.
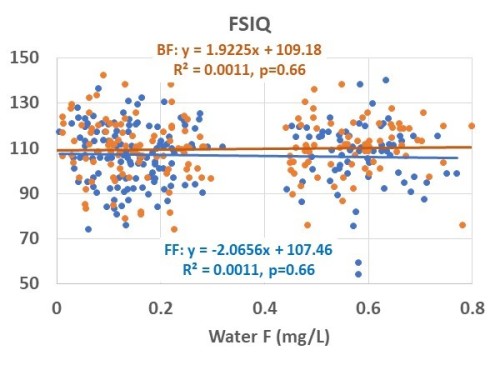
But, let’s look at the FSIQ story – at least the paper provides a figure enabling extraction of data for an independent analysis. The figure below is from the paper’s Figure 1 showing the relationships of FSIQ to drinking water fluoride concentration for breastfed (BF) and formula-fed (FF) babies.

The paper claimed a statistically significant (p<0.05) relationship for formula-fed (FF)(B=-8.80 [-16.34,-0.92]) but not for breastfed (BF) babies.
I can’t get the same result with the data I digitally extracted from the figure (about 90% of data points) The extracted data showed for For FF: B=-2.07 (-11.17, 7.04), p=0.6 and for BF B=1.92 (-6.74, 10.59).
The difference surprises me. I am aware I was able to extract only about 90% of the data points (n=354 compared with the paper’s 398) but would not have expected such a large difference in regression result. I would dearly like someone to duplicate this as a check.
These were the results I obtained using the data I digitally extracted from Figure 1 in Till et al., (2020).
Perhaps this is just another indication that the relationship is very weak.
But, Importantly, the IQ relationships were not significant when outliers and covariate effects were included. Till et al., (2020) found the significant relationship they reported for FF disappeared when the 2 low IQ outliers were removed. The regression without the outliers was B=-6.28 (-13.98, 1.42), no p-value given. The relationship also disappeared when maternal urinary fluoride (MUF) was included as a covariate. But before I get the response this proves that MUF, rather than FF is the determining factor, Till also reported (in the supplementary data) that “MUF was not significantly associated with FSIQ score (B = -0.54, 95% CI: -3.04, 0.90, p = .28).”
Why concentrate on FSIQ instead of PIQ?
The authors include only a figure for FSIQ plotted against water concentration. This seems strange as the quoted relationship disappears when the 2 outliers are excluded or covariates included in the regression.
In contrast, the relationship of PIQ with water concentration is statistically significant for both breastfed and formula-fed infants and remained significant when controlled for maternal; urinary fluoride or when the 2 outliers are removed. (The authors could not find any statistically significant relationships for VIQ). The effect size was also much larger than that found (before adjustment) for FSIQ.
Whereas the B value for the relationship of FSIQ with water fluoride before adjustment was -8.8 IQ points per 1 mg/L water fluoride the equivalent coefficients for PIQ were:
Formula-fed children: B=-18.52 (-27.54, -9.52);
Breastfed children: B=-12.38 (-20.90, -3.88)
These B coefficients were a little smaller when adjustments were made for the 2 outliers or for maternal urinary fluoride but they were still statistically significant (p,0.05).
So, why no figure for PIQ vs water fluoride? I would have thought such a figure would be far more important for the paper than the included one for FSIQ (where the relationship became non-significant when adjustments were made). Data extracted from a PIQ figure would also have enabled determination of how much of the PIQ variance was explained by water fluoride. Although, the very large 95% confidence interval range suggests to me that very little of the PIQ is actually explained by water fluoride. I think the strange data presentation may have been a result of attemtps to confirm a bias.
The anti-fluoride people have talked about IQ (meaning FSIQ) rather than PIQ in their promotion of the study. Perhaps they have not actually read the paper. They seem not to realise that the relationship they rely on disappears when considered properly.
And it is not just a convenient shorthand. For example, The Fluoride Action Network press release says:
“A study published this week found a large decrease in the IQ of children who had been fed infant formula reconstituted with fluoridated tap water, compared to formula-fed children living in unfluoridated areas. The study by a research team based at York University, Toronto, followed a large cohort of Canadian mother-child pairs through age 3-4 years and found an average drop of over 4 IQ points for children in fluoridated areas.”
The local Fluoride Free NZ (FFNZ) press release also makes clear they are referring to FSIQ:
“children lose 4.4 IQ points for every 0.5 mg fluoride added to their drinking water if they are formula-fed rather than breast-fed.”
They clearly refer to the FSIQ relationship where B=-8.8 (or -4.40 for 0.5 mg/L water fluoride concentration).
Did these anti-fluoride people not get past the paper abstract or the press release put out by the authors?
Fluoride intake
The study also included a calculated measure of fluoride intake from formula. The calculation is questionable and was not significantly related to VIQ or FSIQ. However, the relationship with PIQ was significant even after adjustment – although the large 95% confidence interval suggests it did not explain much of the variance in PIQ. I digitally extracted data for the PIQ – F intake figure (their Figure 1B) and regression analysis indicated F-intake explained only about 1.5% of the PIQ variance. (Unfortunately, I was unable to extract more than 78% of the data as a large number of data points seemed to coincide. This is probably inevitable with the method they used to estimate F intake).
Problems with the Till group
I find it interesting that the authors specifically express their coefficient B values for 0.5 rather than the normal 1.0 mg/L water fluoride because they wish to relate their relationship to water fluoridation. They write:
“To aid interpretation, we divided all regression coefficients by 2 so that they represent the predicted IQ difference per 0.5 mg/L of fluoride in tap water or 0.5 mg fluoride from formula; 0.5 mg/L corresponds to the approximate difference between mean water fluoride level in fluoridated versus non-fluoridated regions in our sample.”
This suggests to me the group has a preoccupation of finding fault with community water fluoridation.
Mind you, I had already come to this conclusion because, when taken together, papers coming from this group report relationships that are always weak and very often contradictory. If a relationship isn’t significant when maternal urinary fluoride is used, they switch to water fluoride. If that is not successful they use a non-verified fluoride intake measurement of their own invention. They seem to be searching for any relationship which will confirm their bias.
The truth is that in these and similar studies the data is often not very good (no one should be using spot urine F tests for example) and the relationships found are always very weak. The results are usually confused because of the different parameters used and also the results are often contradictory. For example, data will sometimes show an increase in IQ with fluoridation or drinking water fluoride (see the table above, A conference paper on the maternal prenatal urinary fluoride/child IQ study has problems, What do these mother-child studies really say about fluoridation?, and The anti-fluoride brigade won’t be erecting billboards about this study).
The authors also seem to be very willing to make exaggerated claims linking their weak results to health policies and often seem to work in collusion with some anti-fluoride activist organisations and people. For example, Bruce Lanphear, one of the coauthors on the Green et al., (20219) paper, is serving pro bono as an expert witness for the Fluoride Action Network and other antifluoride groups in a current legal case.
Despite this apparent bias and the weakness of the data in these papers, they should stand on their own merit instead of the reputation (good or bad) of the authors. It is up to interested readers to critically examine the data and make their own decisions about the reliability of the claims being made.
However, this does require readers to actually read the papers and think critically about them. It appears to me that most anti-fluoride campaigners never do this but simply rely on newsletters and press releases coming from “Head Office – the Fluoride Action Network.


More than half of USA children have dental fluorosis, a sign of excess fluoride exposure. . . and yet you still support giving them even more fluoride. When is too much indeed too much?
Of course we all want high quality studies, without causing harm to anyone.
The study of risk and harm is quit different from the study of benefit.
Please provide a study design of fluoride exposure evaluating developmental neurotoxicity which you would find of high quality, and yet confident no harm will be caused to participants.
Would you use urine or serum fluoride concentrations, bone, tooth fluoride concentrations of mother and fetus?
Would you recommend 5, 10, 20, 50 year study?
All known or presumed toxins, such as lead, go through the same discovery curve. Do you have a study on lead or any developmental neurotoxin which meets your requirements of evidence?
Reminds me of the effect pollution has on the environment. . . even when the earth heats up and the oceans rise, there will be no “proof” human pollution had an effect.
Too many are ingesting too much fluoride, especially the young.
LikeLike
Bill,
You seem to be stuck on the same spot on your 33 1/3 rpm vinyl record. That is not surprising from you though. I would expect more from someone with an MPH after their name. However, being a FAN disciple and former Director of FAN.
Dose makes the poison. Ethyl alcohol (ingredient in alcoholic beverages), caffeine, and aspirin are in the same grouping as fluoride in high quantities. Just like Coumarin. At high dosages, it is used along with high dosages of Vitamin D as rat poison. However, at low doses it keeps my parents alive by not throwing blood clots which can cause (not correlation, causation) heart attacks and strokes.
As for a study, why not mention the high quality NTP study from 2018 which showed absolutely no IQ changes or any organ changes even at an equivalent of 4ppm? Well, because it doesn’t suit your bias.
Why not mention these studies?:
1. “Fluorinated water consumption in pregnancy and neuropsychological development of children at 14 months and 4 years of age”, Santa-Marina et al, Oct 2019
“Conclusions: Prenatal exposure at the levels found in fluorinated drinking water may exert a beneficial effect on the development at 4 years of age. At low doses, fluoride could present a dose-response pattern with a beneficial effect.”
2. “The Effects of Fluoride In The Drinking Water”, Aggeborn and Ohman, June 2016. Studied natural fluoride levels in Sweden.
Conclusions:
“We have investigated the effects of fluoride on outcomes related to the central nervous system and more long-term labor market outcomes. We find a zero effect of fluoride on cognitive ability, non-cognitive ability and points on the national test in math. For income and employment status we found evidence of a positive effect of fluoride, which would be in line with the explanation that better dental health is a positive factor on the labor market. We began our analysis by first investigating the dental health effects of fluoride, and could confirm the long well-established positive relationship.”
Lastly, you know that dental fluorosis from water fluoridation falls into the very mild to mild categories. Those are barely noticeable white spots and streaks in the enamel of teeth when examined by a dental professional under bright light and dried off. They are typically not seen by the lay public.
We have investigated the effects of fluoride on outcomes related to the central nervous system and more long-term labor market outcomes. We find a zero effect of fluoride on cognitive ability, non-cognitive ability and points on the national test in math. For income and employment status we found evidence of a positive effect of fluoride, which would be in line with the explanation that better dental health is a positive factor on the labor market. We began our analysis by first investigating the dental health effects of fluoride, and could confirm the long well-established positive relationship.
https://www.cdc.gov/fluoridation/faqs/dental_fluorosis/index.htm
Johnny Johnson, Jr., DMD, MS
Pediatric Dentist
President, American Fluoridation Society
LikeLike
Thanks Ken for your excellent and rapid analysis. We have a challenge for the 3rd time this year in Melbourne, Florida. This paper is being circulated by a city councilor who opposes CWF. I appreciate the quick turnaround and excellent information on it.
Johnny
LikeLike
Johnnyjohnsonjr Your CDC link fails to note that spots on teeth (dental fluorosis) are not only caused by excess fluoride but also by some illnesses. I understand non-symmetrical spots won’t be as a result of fluoride. The fluoride damage is diffuse and symmetrical in the mouth.
Studies looking for fluoride/fluorosis/other connection should note that.
LikeLike