Tag Archives: Bashash

Anti-fluoridation propaganda now relies on only four studies. 6: Incestuous relationship of these studies

A Fluoride Action Network (FAN) propaganda video where Paul Connett urges listeners to consider only four studies when considering the possible harmful effects of fluoridation.

Paul Connett, director of the Fluoride Action Network (FAN), now claims “You only have to read four studies…” to come to the conclusion that community water fluoridation (CWF) is bad for your health. He wants you to ignore all the other research – which is just bad science.

But this is even worse than it looks because these four studies are hardly independent. They basically represent the work of one or two groups and weaknesses in the studies indicate the groups are basically “torturing” data to produce relationships which confirm their likely biases against CWF. The same researchers appear as authors on most of the published papers from these studies.

But that is not all. There is evidence of an “old boy/girl network” operating within these research groups where journal peer reviewers are selected from the same groups.

It’s called “taking in each other’s laundry.”

For earlier articles in this series see:
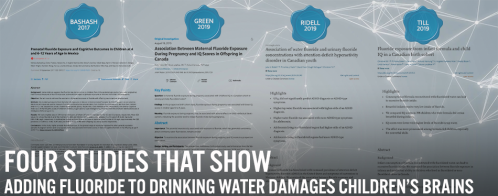
In this article, I discuss the incestuous relationship of the studies promoted by Connett and show these researchers have links to anti-fluoride activism.

Links between the four studies

One indication of the lack of independence of these studies is the fact that the papers have common authors. The figure below reveals these links between the studies via their authors with the names in red being authors on more than one of the papers.

The above diagram indicates the four studies came from no more than 2 groups.

Martinez-Meir is common to both groups – probably because her laboratory was responsible for the analysis of maternal urinary fluoride.

Christine Till has been responsible for several of these studies as she obtained funding on the back of the flawed Malin & Till (2015) study (see Leader of flawed fluoridation study gets money for another go).

Till and Lanphear appear to have responsibility for formulating and designing these studies.

So it is wrong to see these as completely independent studies. They will all be influenced by the biases of the groups involved and the links shown in the figure above suggest coordination in publishing their research findings.

This becomes more apparent when we look at the journals involved in publishing some of this work and the peer reviewers used.

Links with peer reviewers

Unfortunately, very few journals make available the names of peer reviewers or the contents of their reviews. A pity, as I would like to understand better the controversy that seemed to erupt during the journal review of the Green et al (2019) paper, for example. (This controversy resulted in an unprecedented brief statement from the Editor and an opinion piece by David Bellinger promoting the paper – see If at first you don’t succeed . . . statistical manipulation might help).

However, some of the researchers have published their fluoride work in the journal Environmental Health which in recent years has published peer reviewer names and the contents of their reviews. So let’s look at papers published by the authors Connett is promoting where this peer review information is available. They were all published in Environmental Health and are:

This diagram illustrates some of the papers and the reviewers and links the authors and reviewers.

Note: The extra papers considered in the figure are:

Yes, it’s a real network and perhaps it’s not necessary to follow the details of each link. We can see, though, that authors on these papers often appear as journal peer reviewers of other papers from these research groups.

I suspect this situation may be more common in science publishing than we realise – especially as journals now often ask authors to suggest possible reviewers and to specifically name researchers they do not want to review their work.

I think that is bad for the quality of published research. It’s easy to see that in a network like this peer review is done within the groupthink (or bias) that exists in such a network. I raised this problem when commenting on the peer review of an earlier paper from the network – Malin & Till (2015) – in my articles Poor peer-review – a case study and Poor peer review – and its consequencesIn this case, the reviewers were fixated on chemical toxicity as the reason for health problems so did not consider all the other possible factors that might be responsible for the prevalence of ADHD diagnoses. They, therefore, missed completely possible regional effects which were at the time shown as important (see Perrott 2018).

This author/peer-reviewer network is particularly bad in situations like this where a controversial or even flawed paper gets approval simply because of the common biases of authors and peer reviewers.

Links with anti-fluoride campaigners

Notice in the figure above that two of the reviewers for Grandjean’s paper are members of FAN – senior members at that. While their contribution to improving the paper was probably minimal (Spittle’s comment – “The review capably considers recently available information and is highly pertinent to the public health” was worthless) the fact these reviewers were selected by the journal (and possibly by the author who is also the Chief Editor of the journal) indicates some influence.

These links indicate some sort of “under the table” influence and linking of researcher with FAN which probably explains why FAN often seems to have early information about upcoming publications which enable them to launch timely propaganda pieces.

Journals used for publication

Environmental Health is open access and a pay-to-publish journal. Pay-to-publish is becoming more common but many researchers steer away from these journals because they tend to have a reputation that payment encourages publication of bad research. On the positive side (as I said above) the open access policy, in this case, helps us see when the peer reviewers are and understand the problems I have discussed.

A relevant aspect of the author-peer-reviewer network, in this case, is the involvement of journal editors in the network as shown by this diagram.

NOTE: See notes for previous figure.

Phillipe Grandjean is also the author of Grandjean et al (2019) which appeared in the previous figure. I have written about his specific biases regarding fluoride in the past (see Special pleading by Philippe Grandjean on fluoride) and it is notable that as Editor in Chief of Environmental Health he refused to even consider for publication my paper critiquing Malin & Till (2015) (see Fluoridation not associated with ADHD – a myth put to rest).

David Bellinger is linked to the Bashash et al (2018a) study, not as an author, but as the note in the paper says:

“David Bellinger collaborated on the design and execution of this study’s cognitive testing.”

So it’s not surprising to see him authoring a promotion of the Green et al (2019) paper – although the inclusion of that promotion and the special note from the journal’s editor in that issue of the journal is very unusual.

Conclusions

The lack of independence in these four studies really reinforces the danger of limiting one’s reading. It’s not just a matter of restricting reading to four papers – its a matter of restricting information sources to one (or perhaps two) research groups influenced by the same groupthink and biases.

Group thinking and bias within research groups are not new. Nor is it a surprise that journals can be influenced by such group thought and bias and that this influences their acceptance of papers for publication. But if you are aware of the problem then you realise the need not to restrict your reading in the way that Connett is suggesting.

If anything, Connett’s statement is an admission that the overall findings of scientific studies on this issue do not support his case. He admits that all the studies anti-fluoride activists had been relying on in the past suffer from relating only to high fluoride concentrations. His plea people now restrict their reading to only four studies which really limits information sources to one or perhaps two research groups with a bias against CWF, is aimed at censoring the wider information availble.

Even more reason for readers to beware. One should never restrict information sources in the way Connett is suggesting.

See also:

Similar articles


Anti-fluoridation propaganda now relies on only four studies. 2: Green et al (2019)

Paul Connett is putting all his eggs in one basket. He says “you only have to read four studies” to find community after fluoridation harmful. Image credit: Fluoride Action Network newsletter.

For part 1 of this series see Anti-fluoridation propaganda now relies on only four studies. 1: Bashash et al (2018).

Paul Connett, director of the Fluoride Action Network (FAN), now claims “You only have to read four studies…” to come to the conclusion that community water fluoridation (CWF) is bad for your health. As I said in the first article in this series that is simply bad science. One should not ignore all the other relevant studies – and anyway, these four studies do not say what Connett claims.

In this article, I discuss the second study Connett recommends. It’s citation is:

Green, R., Lanphear, B., Hornung, R., Flora, D., Martinez-Mier, E. A., Neufeld, R., … Till, C. (2019). Association Between Maternal Fluoride Exposure During Pregnancy and IQ Scores in Offspring in Canada. JAMA Pediatrics, 1–9.

Green at al (2019)

According to Connett:

“The second* came in 2019 when a study published in JAMA Pediatrics essentially replicated the Mexico City finding in Canadian communities.”

Table 2 summarises the results obtained by Green et al (2019). Let’s compare them with the results found by Bashash et al (2018) as presented in the first article in this series – Anti-fluoridation propaganda now relies on only four studies. 1: Bashash et al (2018).

Table 2: Summary of results from Green et al (2019). Red triangles indicate a statistically significant relationship.

Note: See Table 1 for an explanation  of symbols and bars

No, Green et al (2019) did not “replicate” the findings of Bashash et al (2017) – although Connett may be using the word “essentially” to cover up his over-confidence in the claim.

Unlike Bashash et al (2017), Green et al (2019) did not find a statistically significant relationship of child IQ (FSIQ) with MUF. However, when they separated the children by sex the relationship was significantly negative for males (positive, but not statistically significant, for females). They also reported statistically significant relationships of IQ with maternal F intake estimated using an unvalidated subjective method, but not with drinking water F.

When the IQ (FSIQ) was separated into subsets no significant relationship was found for verbal IQ (VIQ) but there was a significant relationship with MUF of performance (PIQ) for boys. There was also a significant relationship of PIQ with drinking water F. So quite a mixed bag – and perhaps indicating that separating the data into different groups based on sex and using different cognitive measures can tweak out significant relationships. But it reminds me of the old saying that one can get the answer one wants if the data is tortured enough.

As for the statistically significant relationships reported by Green et al (2019) – none of them are at all “strong” as can be seen in these figures taken from the paper:

Antifluoride campaigners use of this paper in their propaganda relies on a very weak relationship which, according to Green (2018) explains only 4.7% of the variance in IQ, and required separation of children by sex to get statistical significance.

Polishing data and ignoring non-significant relationships

A concern I have about this study is the differences in the findings reported in the original MA thesis of Green (2018) and the final paper of Green et al (2019). For example, the thesis reported an adjusted association of FSIQ with fluoride intake (B = -3.82, 95% CI: -7.65 to 0.02, p = .05) which she describes as having “just missed significance” while the final paper reports this association as significant (B = -3.66, 95% CI: -7.16 to -0.15, p = 0.04). What was done to move this association into statistical significance?

I am also concerned that not all the non-significant associations recorded in the thesis are reported in the final paper. For example, Green (2018) reported that neither VIQ or PIQ was significantly associated with fluoride intake and VIQ was not significantly associated with water fluoride concentration and these facts were not reported in Green at al (2019). On the other hand, the significant relationship of PIQ with water fluoride concentration was reported in the final paper.

Selectively reporting results of statistical analyses like this gives a false impression of how important the results may be in practice. Sure, I can understand why authors will bias their presentation in this way but a good peer review should identify this bias and insist on the presentation of complete results.

Oh, and the overall comparison of child IQ from areas of residence of their mothers during pregnancy did not show any statistically significant difference due to fluoridation in Green et al (2019) – see Table 3.

Table 3: Comparison of cognitive scores obtained by Green et al (2019) for children of mothers living in fluoridated and unfluoridated areas during pregnancy

Connett is wrong to claim that the Green et al (2019) study “replicated” the Bashash et al (2017). It didn’t by a long shot. The study itself is also very weak, it has several faults and has been widely criticised in the scientific community.

Tomorrow I will discuss the third study Connett now relies on – Riddell et al (2019) – see Anti-fluoridation propaganda now relies on only four studies. 3: Riddell et al (2019).

See also:

Similar articles

Anti-fluoridation propaganda now relies on only four studies. 1: Bashash et al (2018)

This is the advice from the very top of the anti-fluoride movement – Paul Connett, director of the Fluoride Action Network (FAN). Don’t worry about reading  up on all the scientific information “You only have to read four studies…”

Of course – that is bad science. To ignore all the other information and rely just on four studies. But it is also bad science as those specific studies were chosen by Paul Connett because he believes they confirm his bias that community water fluoridation (CWF) is bad for you (they don’t actually). He consistently ignores studies which contradict his bais. But it is also bad science because these studies are weak and their results contradictory. Connett is simply into confirmation bias. He uses misrepresentation and mistaken interpretation of these studies to support his claims.

Connett acknowledges problems with high fluoride studies

Connett admits in his Fluoride Action Network (FAN) Bulletin from March 24, 2020:  “You only have to read four studies…” that “Many of the earlier studies were in places with elevated natural fluoride levels.” Yes – they are overwhelmingly from areas of endemic fluorosis, mainly in China, where health problems are very common and obvious. They have no relevance to community water fluoridation (CWF) – but this did not stop Connett, FAN and the whole anti-fluoride movement using them in their propaganda opposing a safe, effective and economic health policy known to reduce child tooth decay.

Then he goes on to claim:

“There is now very strong evidence that fluoride damages both the fetal and infant brain at the levels used in artificially fluoridated areas.”

“You only have to read four studies to realize that deliberately adding fluoride to drinking water unnecessarily endangers children’s brains.”

Let’s be scientific about it and have an objective and critical look at the specific studies Connett now relies on. I will discuss each of these four studies in separate articles. Here is my critique of the first one – Bashash et al (2017)

Bashash et al (2017)

The citation for this paper is:

Bashash, M., Thomas, D., Hu, H., Martinez-mier, E. A., Sanchez, B. N., Basu, N., … Hernández-avila, M. (2017). Prenatal Fluoride Exposure and Cognitive Outcomes in Children at 4 and 6 – 12 Years of Age in Mexico. Environmental Health Perspectives, 125(9).

Connett says:

“The first* came in Sept 2017 with a groundbreaking study from Mexico City. This study found a strong association between the amount of fluoride women were exposed to during pregnancy and lowered IQ in their offspring.”

Don’t take Connett’s word for this – read the paper and actually look at and consider the data.

Table 1 illustrates results from Bashash et al (2018) and from Thomas (2014) and Thomas et al (2013, 2014 & 2018): These all used the same or similar data from the ELEMENT database. The red triangles represent statistically significant relationships. All other relationships are not statistically significant.

Table 1: Summary of data from papers using the Mexican ELEMENT database. Red triangles indicate a statistically significant relationship.

Note: The coefficients were obtained from linear regression of full-scale child intelligence quotient (IQ), general cognitive index for the child (GCI) or mental development index of the child (MDI) against urinary fluoride for the child (UF) or prenatal urinary fluoride for the mother (MUF), adjusted in some cases using urine specific gravity (MUFsg) or urine creatinine concentrations (MUFcr). Bars represent the 95% confidence intervals of coefficients of the change of cognitive measure with an increase in fluoride measure. The red triangles represent statistically significant relationships. All other relationships are not statistically significant.

No relationship of child IQ with child urinary F:

Connett does not mention that there is no significant relationship of child IQ with fluoride exposure as measured by the child urinary F (UFsg) and he is also silent about the Thomas (2014) thesis which also showed no relationship of child MDI with child UF – although when Thomas (2014) separated data by sex she found a statistically significant positive relationship of IQ with UF for males.

Relationships with maternal prenatal urinary F – but very weak:

Yes, there are significant relationships of child IQ (6 – 12-year-olds) or child GCI (4-year-olds) with MUF – but contrary to Connett’s claim these relationships are far from “strong.” (Thomas did not find a significant relationship of MDI with  MUF for children of ages 1 to 3  but reported – in a conference poster paper Thomas et al 2018 – a statistically significant relationship for MUF corrected using creatinine concentrations – see  A conference paper on the maternal prenatal urinary fluoride/child IQ study has problems).

These figures from Bashash et al (2017) illustrate how scattered the data is:

While statistically significant the reported relationships are extremely weak – explaining only about 3.6% of the variance in IQ and 3.3% of the variance in GCI (see Maternal urinary fluoride/IQ study – an update). The large standard error of the regressions (9.8 for IQ and 12.9 for GCI) also indicate that the estimates of IQ change (-5.0) and GCI change (-6.3) for an increase of MUF of 1 mg/L  have no predictive value (see Maternal urinary fluoride/IQ study – an update).

Connett is very wrong to claim that “This study found a strong association . . .” It simply didn’t.

Tomorrow I will discuss the second study Connett now relies on – Green et al (2019) – see Anti-fluoridation propaganda now relies on only four studies. 2: Green et al (2019).

See also:

Similar articles

Fluoridation and ADHD: A new round of statistical straw clutching

“To clutch at straws – the act of reaching for a solution no matter how irrational or inconsequential.” Source: Advanced Vocabulary for English Language Learners

Anti-fluoridation activists are promoting a number of new scientific papers they argue support their campaigns. But one has only to critically read these papers to see they are clutching at straws. Their promotion relies on an unsophisticated understanding of statistics and confirmation bias.

I will look at one paper here – that of Bashash et al., (2018) which reports an association between maternal prenatal urinary fluoride and prevalence of child ADHD.

The paper is:

Bashash, M., Marchand, M., Hu, H., Till, C., Martinez-Mier, E. A., Sanchez, B. N., … Téllez-Rojo, M. M. (2018). Prenatal fluoride exposure and attention deficit hyperactivity disorder (ADHD) symptoms in children at 6–12 years of age in Mexico City. Environment International, 121(August), 658–666.

I discussed an earlier paper  by these authors – Bashash et al., (2016) which reported an association between maternal neonatal IQ fluoride and child IQ – (also heavily promoted by anti-fluoride activists) in a number of articles:

Promotion of the new paper by anti-fluoride activists suffers from the same problems I pointed out for their promotion of the earlier paper. In particular it ignores the fact that the reported relationships (between maternal neonatal urinary fluoride and cognitive measure for children in Bashash et al., 2016, and prevalence of child  attention deficit hyperactivity disorder – ADHD – in Bashash et al., 2018) were very weak and explain only a very small amount of the variation. This raises the possibility that the reported weak relationships would disappear if significant risk-modifying factors were included in the statistical analyses.

Bashash, et al., (2018)

Whereas the earlier paper considered measures of cognitive deficits in the children the current paper considers various measurements related to ADHD prevalence among the children. These include parent rating scales (CRS-R). Three were ADHD-related scales from the Diagnostic and Statistical Manual of Mental Disorders (DSM) (Inattention Index, Hyperactivity-Impulsive Index and Total Index [inattentive and hyperactivity-impulse behaviours combined]). They also include several other indexes related to ADHD.

A number of computer-assisted indexes (CPT-II) were also determined.

Most indices were not significantly associated with maternal prenatal urinary fluoride. However, the authors reported statistically significant (p<0.05) relationships for indices of Cognitive Problems + Inattention, ADHD Index, DSM Inattention and DSM ADHD Total.

The data and the relationships were provided in graphical form – see figure below – taken from their Figure 2:

There is obviously a wide scatter of data points indicating that the observed relationships, although statistically significant, explain only a small part of the variation in the indices.

So, just how good are the relationships reported by Bashash et al., (2018) in explaining the variation in these ADHD-related indices? I checked this out by digitally extracting the data from the figures and using linear regression analysis.

Index

% Variance explained

Cognitive problems + Inattention 2.9%
ADHD Index 3.1%
DSM Inattention 3.6%
DSM ADHD Total 3.2%

In fact, these relationships are extremely weak – explaining only a few per cent of the observed variation in the ADHD related indices. This repeats the situation for the cognition-related indices reported on the Bashash et al., (2016) paper (see Maternal urinary fluoride/IQ study – an update).

The fact these relationships were so weak has two consequences:

  1. Drawing any conclusions that maternal neonatal fluoride intake influences child ADHD prevalence is not justified. There are obviously much more important factors involved that have not been considered in the statistical analysis.
  2. Inclusion of relevant risk-modifying factors in the statistical analysis will possibly remove any statistical significance of the relationship with maternal urinary fluoride.

Credible risk-modifying factors not considered

Bashash et al., (2108) do list a number of possible confounding factors they considered. These did not markedly influence their results. however, other important factors were not included.

Nutrition is an important factor. Malin et al., (2108) reported a signficant effect of nutrition on cognitive indices for a subsample of the mother-child pairs in this study (see A more convincing take on prenatal maternal dietary effects on child IQ).

Their statistical analyses show that nutrition could explain over 11% of the variation in child cognitive indices indicating that nutrition should have been included as a possible risk-modifying factor in the statistical analyses of Bashash et al., (2016) and Bashash et al., (2018). I can appreciate that nutrition data was not available for all the mother-child pairs considered in the Bashash et al., papers. However, I look forward to a new statistical analysis of the subset used by Malin et al., (2108) which includes prenatal maternal urinary fluoride as a risk-modifying factor and tests for relationships with child ADHD prevalence.

Could the reported weak relationship disappear?

Possibly. After all, it is very weak.

The problem is that urinary fluoride data could simply be a proxy for a more important risk-modifying factor. That is, urinary fluoride could be related to other risk modifying factors (eg. nutrition) so that the relationship with urinary fluoride could disappear when these other factors are included.

I illustrated this for a earlier reported relationship of child ADHD prevalence with extent of fluoridation in US states (see Perrott 2017 – Fluoridation and attention deficit hyperactivity disorder – a critique of Malin and Till (2015)). In  that case the relationship was much better than those reported by Bashash et al., (2016) and Bashash et al., (2018) – explaining 24%, 22% and 31% of the variance in ADHD prevalence for the years 2003, 2007 and 2011 respectively. The relationships are illustrated in their figure:

Relationships between water fluoridation (%) and child ADHD prevalence for 20013 (red triangles), 2007 (blue diamonds) and 2011 (purple circles). Malin & Till (2105)

Yet, when other risk-modifying factors (particularly mean state elevation) not considered by Malin & Till (2015) were included in the regression analyses there was no statistically significant influence from fluoridation prevalence. In this case fluoridation prevalence was related to altitude and was simply acting as a proxy for altitude in the Malin & Till (2015) regression.

Conclusion

As the authors admit, this study:

“was not initially designed to study fluoride exposure and so we are missing some aspects of fluoride exposure assessments (e.g., detailed assessments of diet, water, etc.).”

However, they do say these “are now underway” so I look forward with interest to the publication of a more complete statistical analysis in the future.

There are other problems with the data (for example the paucity and nature of the urinary fluoride measurements) and these are the sort of issues inevitably confronting researchers wishing to explore existing data rather than design experimental protocols at the beginning.

Readers should therefore always be hesitant in their interpretations of the results and the credibility or faith that they put on the conclusions of such studies. The attitude should be: “that is interesting – now let’s design an experiment to test these hypothetical conclusions.”

The problem is confirmation bias – the willingness to give more credibility to the findings than is warranted. Scientists are only human and easily succumb to such biases in interpreting their own work. But this is even more true of political activists.

The reported relationships are weak. Important risk-modifying factors were probably not included in the statistical analyses. The observed relationships may simply mean that urinary fluoride is acting as a proxy for a more important risk-modifying factor (like nutrition) and the weak relationship may disappear when these are considered.

So scientific assessment of this study will be extremely hesitant – interpreting it, at best, as indicating need for more work and better designed research protocols.

But, of course, political activists will lap it up. It confirms their biases. Political activist organisations like the Fluoride Action Network are heavily promoting this paper – as they did with the earlier Bashash et al., (2016) paper.

But they are simply clutching at straws – as they often are when using science (or more correctly  misrepresenting and distorting the science) to support their political demands.

Similar articles


A more convincing take on prenatal maternal dietary effects on child IQ

Image credit: Nutrition and Pregnancy: Choline For Baby’s Development

Prenatal maternal nutrition is more likely to influence child cognitive abilities than fluoride. A new paper shows this by considering the effects of good or bad prenatal nutrition for the women in the Basash et al., (2016)  study that anti-fluoride campaigners promote. The new data shows that nutrition is more important than fluoride.

The Bashash et al. (2016) reported a weak relationship between prenatal maternal urinary fluoride and child cognitive outcomes or IQ (see Fluoridation: “debating” the science?). Anti-fluoride campaigners latched on to the paper because it seems to offer critical “evidence” for their claims that community water fluoridation lowers IQ. They argue that IQ, rather than the risk of dental fluorosis, should be the main consideration when considering community water fluoridation.

But a new study shows that prenatal maternal nutrition is a better predictor of neurodevelopmental outcomes for children than is urinary fluoride. This study used data from the same set of Mexican women/child pairs as Bashash et al., (2016).

Here is the citation for the new study:

Malin, A. J., Busgang, S. A., Cantoral, A. J., Svensson, K., Orjuela, M. A., Pantic, I., … Gennings, C. (2018). Quality of Prenatal and Childhood Diet Predicts Neurodevelopmental Outcomes among Children in Mexico City. Nutrients, 10(8), 1093.

Misrepresentation  of the Bashash et al., (2016) study

I have dealt with this in a number of articles. Basically my argument was not with the study itself (although it obviously lacks consideration of important risk-factors in it statistical analysis) but with the way anti-fluoride activists use it to draw unwarranted conclusions.

A key problem they ignore is that the relationships reported by Bashash et al., 2016 can explain only about 3% of the variation in the cognitive measurements. This strongly suggests that the relationship with prenatal urinary fluoride would probably disappear if more important risk-modifying factors were included in the statistical analysis. My article “Predictive accuracy of a model for child IQ based on maternal prenatal urinary fluoride concentration.”  explains this and is available online.

The new Malin et al., (2108) study now provides some risk-modifying factors, specifically diet, which explains the data better than does urinary fluoride.

Readers wishing to refer back to my earlier posts on misrepresentation of the Bashash et al., (2106) study can read:

Diet as a predictor of neurodevelopmental outcomes

The statistical analyses in this new paper are quite complex because the authors considered nutrient mixture and not simply each nutrient in isolation. Their argument for this is that we consume nutrients as mixtures and that interactions between nutrients is always possible.

The study, therefore, looked at the relationship of different neurodevelopmental outcomes in the children with prenatal maternal diet. Initially the authors considered the predictive ability of nutrition by considering “good” or “bad” diets based on U.S. dietary guidelines.

A bad diet during pregnancy may harm your future child’s neurodevelopment. Credit: © ivanmateev / Fotolia

Good maternal prenatal nutrition had a significantly positive effect on all the neurodevelopmental outcomes measured. In contrast, poor nutrition had a significantly negative effect on all the outcomes (see table below). Weighted Quartile Sums (WQS) were used to create indices for the individual diets.

I compared the predictive ability of prenatal maternal nutrition used here with the prenatal maternal urinary F approach used by Bashash et al., (2016) using data digitally extracted from their supplemental figures (S1 and S2 – see below). This was for the verbal development score of the children. Unfortunately, this was the only individual data presented.

Clearly, there is a lot of scatter in the data – to be expected where a number of risk-modifying factors are involved. However, the data showing a positive effect of good maternal prenatal nutrition on the verbal score of the children explains 7.1% of the variation. The data for poor prenatal nutrition explains 11.2% of the variation.

Compare this with the predictive ability of the data present by Bashash et al., (2016) where maternal prenatal urinary fluoride could only explain 3% of the variation of the child cognitive scores (see Maternal urinary fluoride/IQ study – an update).

Malin et al., (2018) were able to show which nutrients contributed most to the positive or negative neurodevelopmental outcomes of the children. They concluded:

“mothers who consumed more nutritious diets during pregnancy tended to have children with more favorable neurodevelopmental outcomes, while mothers who consumed less nutritious diets and/or higher levels of sodium, saturated fat, and/or sugar during pregnancy tended to have children with poorer neurodevelopmental outcomes. This suggests that the consumption of more comprehensively nutritious prenatal diets favorably affects child  neurodevelopment, while the consumption of less comprehensively nutritious prenatal diets may hinder it.”

Individual nutrients affected specific neurodevelopmental factors but they reported that prenatal dietary thiamine, vitamin B6, monounsaturated fats, fibre and calcium had beneficial effects. In contrast, lower monounsaturated fat, lower thiamine, lower fibre and higher saturated fat were associated with lower neurodevelopmental scores for the children.

Conclusions

If anti-fluoride activists are really concerned about child IQ and other aspects of child neurodevelopment then they should be campaigning on the importance of nutrition during pregnancy and stop diverting us by scaremongering about community water fluoridation.

Similar articles

A conference paper on the maternal prenatal urinary fluoride/child IQ study has problems

Image credit: Do new mothers doing a Ph.D. get enough support?

The anti-fluoride movement has certainly mobilised over the prenatal maternal urinary fluoride study which reported an association with child IQ. They see it as the best thing since sliced bread and believe it should lead to the end of fluoridation worldwide.

They also seem to be putting all their eggs in this one basket and have started a campaign aimed at stopping pregnant women from drinking fluoridated water (See Warning to Pregnant Women: Do Not Drink Fluoridated Water).

So I was not surprised to see a newsletter this morning from the Fluoride Action Network reporting another output from this study – a conference paper (most likely a poster) presented at the  3rd Early Career Researchers Conference on Environmental Epidemiology. The meeting was in Freising, Germany, on 19-20 March 2018.

I had been aware of the poster for the last week so had expected FAN to gleefully jump on it and start promoting it in their campaigns.

Here is a link to the abstract:

Thomas, D., Sanchez, B., Peterson, K., Basu, N., Angeles Martinez-Mier, E., Mercado-Garcia, A., … Tellez-Rojo, M. M. (2018). Prenatal fluoride exposure and neurobehavior among children 1-3 years of age in Mexico. Occupational and Environmental Medicine, 75(Suppl 1), A10–A10.

It’s only an abstract and it may be some time before a formal paper is published, if at all. Posters do not get much in the way of peer review and often not followed by formal papers.  So I can’t say much about the poster at this stage as I never like to make an assessment of studies on the basis of abstracts alone.

But, in this case, I have Deena Thomas’s Ph.D. thesis which was the first place the work was reported. If you are interested you can access it from this link:

Thomas, D. B. (2014). Fluoride exposure during pregnancy and its effects on childhood neurobehavior: a study among mother-child pairs from Mexico City, Mexico. University of Michigan.

I will wait for a formal paper before properly critiquing the poster, but at the moment I find a big discrepancy between the Thesis conclusions and the conclusions presented in the poster abstract.

Thesis conclusions

In her work, Deena Thomas used the Mental Development Index (MDI) which is an appropriate way of determining neurobehavioral effects in young children.

She concluded in her thesis (page 37):

“Neither maternal urinary or plasma fluoride was associated with offspring MDI scores”

And (page 38):

“This analysis suggests that maternal intake of fluoride during pregnancy does not have a strong impact on offspring cognitive development in the first three years of life.”

And further (page 48):

“Maternal intake of fluoride during pregnancy does not have any measurable effects on cognition in early life.”

So – no association found of child MDI score with maternal prenatal urinary F concentrations.

Poster conclusions

But the poster tells a different story.

The abstract concluded:

“Our findings add to our team’s recently published report on prenatal fluoride and cognition at ages 4 and 6–12 years by suggesting that higher in utero exposure to F has an adverse impact on offspring cognitive development that can be detected earlier, in the first three years of life.”

So her conclusions reported in her thesis are exactly the opposite of the conclusions reported in her conference poster!

What the hell is going on?

The data

Obviously, I do not have access to the data and she does not provide it in her thesis. But from her descriptions of the data in her thesis and her poster perhaps we can draw some tentative conclusions.

The table below displays the data description, and a description of the best-fit line determined by statistical analysis, in her thesis and her poster.

Information on data Thomas Ph.D. Thesis Conference abstract
Number of mother/child pairs 431 401
Maternal Urinary F range (mg/L) 0.110 – 3.439 0.195 – 3.673
Mean maternal urinary F (mg/L) 0.896 0.835
Model β* -0.631 -2.40
Model p-value 0.391 – Not significant
95% CI for β -4.38 to -0.40

*β is the coefficient, or slope, of the best-fit line

Conclusions

Apparently at least 30 data pairs have been removed from her thesis data to produce the dataset used for her poster. Perhaps even some data pairs were added (the maximum urinary F value is higher in the smaller data set used for the poster).

This sort of change in the data selected for the statistical analysis could easily swing the conclusion from no effect to a statistically significant effect. So the reasons for the changes to the dataset are of special interest.

Paul Connett claims this poster “strengthens” the findings reported in the Bashash paper.  He adds:

“This finding adds strength to the rapidly accumulating evidence that a pregnant woman’s intake of fluoride similar to that from artificially fluoridated water can cause a large loss of IQ in the offspring.”

But this comes only by apparently removing the conflicting conclusions presented in Deela Thomas’s Ph.D. thesis. We are still left with the need to explain this conflict and why a significant section of the data was removed.

To be clear – I am not accusing Thomas et al. (2018) of fiddling the data to get the result they did. Just that, given the different conclusions in her thesis and the poster,  there is a responsibility to explain the changes made to the dataset.

From the limited information presented in the poster abstract, I would think the scatter in the data could be like that seen in the Bashash et al. (2017) paper. The coefficient of the best fit line (β) is relatively small and while the 95% CI indicates the fit is statistically significant its closeness to zero suggest that it is a close thing.

However, let’s look forward to getting better information on this particular study either through correspondence or formal publication of a research paper.

Other articles on the Mexican study

Fluoride, pregnancy and the IQ of offspring,
Maternal urinary fluoride/IQ study – an update,
Anti-fluoridation campaigners often use statistical significance to confirm bias,
Paul Connett “updates” NZ MPs about fluoride?
Paul Connett’s misrepresentation of maternal F exposure study debunked,
Mary Byrne’s criticism is misplaced and avoids the real issues

Similar articles

Mary Byrne’s criticism is misplaced and avoids the real issues

Image credit: BuildGreatMinds.Com

First, thanks to Mary Byrne and FFNZ for this response (see Anti-fluoride group coordinator responds to my article). Hopefully, this will help encourage some good faith scientific discussion of the issues involved in my original article (Paul Connett’s misrepresentation of maternal F exposure study debunked). I am pleased to promote such scientific exchange.

I will deal with the issues Mary raised point by point. But first, let’s correct some misunderstandings. Mary claimed I am a “fluoride promoter” and had “sought to discredit the study via his blog posts and tweets.”

  1. I do not “promote fluoride.” My purpose on this issue has always been to expose the misinformation and distortion of the science surrounding community water fluoridation (CWF). I leave promotion of health policies to the health experts and authorities.
  2. I have not “sought to discredit the study.” The article Mary responded to was a critique of the misrepresentation of that study by Paul Connett – not an attack on the study itself. This might become clear in my discussion below of the study and how it was misrepresented.

The study

The paper we are discussing is:

Bashash, M., Thomas, D., Hu, H., Martinez-mier, E. A., Sanchez, B. N., Basu, N., … Hernández-avila, M. (2016). Prenatal Fluoride Exposure and Cognitive Outcomes in Children at 4 and 6 – 12 Years of Age in Mexico.Environmental Health Perspectives, 1, 1–12.

Anti-fluoride activists have leaped on it to promote their cause – Paul Connett, for example, claimed it should lead to the end of community water fluoridation throughout the world! But this is not the way most researchers, including the paper’s authors, see the study. For example, Dr. Angeles Martinez-Mier, co-author and one of the leading researchers,  wrote this:

1. “As an individual, I am happy to go on the record to say that I continue to support water fluoridation”
2. “If I were pregnant today I would consume fluoridated water, and that if I lived in Mexico I would limit my salt intake.”
3.  “I am involved in this research because I am committed to contribute to the science to ensure fluoridation is safe for all.”

Was the reported association statistically significant?

Mary asserts:

“Perrott claims that the results were not statistically significant but his analysis is incorrect.”

That is just not true. I have never claimed their reported association was not statistically significant.

I extracted the data they presented in their Figures 2 and 3A and performed my own regression analysis on the data. This confirmed that the associations were statistically significant (something I never questioned). The figures below illustrating my analysis were presented in a previous article (Maternal urinary fluoride/IQ study – an update). These results were close to those reported by Bashash et al., (2017).

For Fig. 2:

My comment was – “Yes, a “statistically significant” relationship (p = 0.002) but it explains only 3.3% of the variation in GCI (R-squared = 0.033).”

For Fig 3A:

My comment was – “Again, “statistically significant” (p = 0.006) but explaining only 3.6% of the variation in IQ (R-squared = 0.0357).”

So I in no way disagreed with the study’s conclusions quoted by Mary that:

” higher prenatal fluoride exposure, in the general range of exposures reported for other general population samples of pregnant women and nonpregnant adults, was associated with lower scores on tests of cognitive function in the offspring at age 4 and 6–12 y.”

I agree completely with that conclusion as it is expressed. But what Mary, Paul Connett and all other anti-fluoride activists using this study ignore is the real relevance of this reported association. The fact that it explains only about 3% of the IQ variance. I discussed this in the section The small amount of variance explained in my article.

This is a key issue which should have been clear to any reader or objective attendee of Paul Connett’s meeting where the following slide was presented:

Just look at that scatter. It is clear that the best-fit line explains very little of it.  And the 95% confidence interval for that line (the shaded area) does not represent the data as a whole. The comments on the statistical significance and confidence intervals regarding to the best-fit line do not apply to the data as a whole.

Finally, yes I did write (as Mary quotes) in my introductory summary that “the study has a high degree of uncertainty.” Perhaps I should have been more careful – but my article certainly makes clear that I am referring to the data as a whole – not to the best fit line that Connett and Mary concentrate on. The regression analyses indicate the uncertainty in that data by the low amount of IQ variance explained (the R squared values) and the standard error of the estimate (about 12.9 and 9.9 IQ points for Fig 2 and  Fig 3A respectively).

The elephant in the room – unexplained variance

Despite being glaringly obvious in the scatter, this is completely ignored by Mary, Paul Connett and other anti-fluoride activists using this study. Yet it is important for two reasons:

  • It brings into question the validity of the reported statistically significant association
  • It should not be ignored when attempting to apply these findings to other situations like CWF in New Zealand and the USA.

Paul Connett actually acknowledged (in a comment on his slides) I was correct about the association explaining such small amount of the variance but argued:

  • Other factors will be “essentially random with respect to F exposure,” and
  • The observed relationship will not be changed by the inclusion of these other factors.

I explained in my article Paul Connett’s misrepresentation of maternal F exposure study debunked how both these assumptions were wrong. In particular, using as one example the ADHD-fluoridation study I have discussed elsewhere (see Perrott, 2017). I hope Mary will refer to my article and discussion in her response to this post.

While ignoring the elephant in the room – the high degree of scattering, Mary and others have limited their consideration to the statistical significance and confidence intervals of the reported association – the association which, despite being statistically significant, explains only 3% of the variation (obvious from the slide above.

For example, Mary quotes from the abstract of the Bashash et al., (2017) paper:

“In multivariate models we found that an increase in maternal urine fluoride of 0.5mg/L (approximately the IQR) predicted 3.15 (95% CI: −5.42, −0.87) and 2.50 (95% CI −4.12, −0.59) lower offspring GCI and IQ scores, respectively.”

I certainly agree with this statement – but please note it refers only to the model they derived, not the data as a whole. Specifically, it applies to the best-fit lines shown in Fig 2 and Fig 3A as illustrated above. The figures in this quote relate to the coefficient, or slope, of the best fit line.

Recalculating from 0.5 mg/L to 1 mg/L this simply says the 95% of the coefficient values, or slopes, of the best fit lines resulting from different resampling should be in the range  -10.84 to -1.74 CGI (Fig 2) and -8.24 to 1.18 IQ (Fig 3A).

[Note – these are close to the CIs produced in my regression analyses described above – an exact correspondence was not expected because digital extraction of data from an image is never perfect and a simple univariate model was used]

The cited CI figures relate only to the coefficient – not the data as a whole. And, yes, the low p-value indicates the chance of the coefficient, or slope, of the best-fit line being zero is extremely remote. The best fit line is highly significant, statistically. But it is wrong to say the same thing about its representation of the data as a whole.

This best-fit line explains only 3% of the variance in IQ – and a simple glance at the figures shows the cited confidence intervals for that line simply do not apply to the data as a whole.

The misrepresentation

That brings us back to the problem of misrepresentation. We should draw any conclusions about the relevance of the data in the Bashash et al., (2017) study from the data as a whole – not just from the small fraction with an IQ variance explained by the fitted line.

Paul Connett claimed:

“The effect size is very large (decrease by 5-6 IQ points per 1 mg/L increase in urine F) and is highly statistically significant.”

But this would only be true if the model used (the best-fit line) truly represented all the data. A simple glance at Fig 2 in the slide above shows that any prediction from that data with such a large scatter is not going to be “highly statistically significant.” Instead of relying on the CIs for the coefficient or slope of the line, Connett should have paid attention to the standard error for estimates from the data as a whole given in the Regression statistics of the Summary output. – For Fig. 2, this is 12.9 IQ points. This would have produced an estimate of “5-6 ± 36 IQ points which is not statistically significantly different to zero IQ points,”  as I described in my article

Confusion over confidence intervals

Statistical analyses can be very confusing, even (or especially) to the partially initiated. We should be aware of the specific data referred to when we cite confidence intervals (CIs).

For example, Mary refers to the CI values for the coefficients, or slopes, of the best fit lines.

Figs 2 and 3A in the Bashash et al., (2017) paper include confidence intervals (shaded areas) for the best fit lines (these take into account the CIs of the constants as well as the CIs of the coefficients). That confidence interval describes the region of 95% probability for where the best-fit line will be.

Neither of those confidence intervals applies to the data as a whole as a simple glance at Figs 2 and 3A will show. In contrast, the “prediction interval” I referred to in my article, does. This is based on the standard error of the estimate listed in the Regression statistics. Dr. Gerard Verschuuren demonstrated this in this figure from his video presentation.

Mary is perfectly correct to claim “it is the average effect on the population that is of interest” – but that is only half the story as we are also interested in the likely accuracy of that prediction. The degree of scatter in the data is also relevant because it indicates how useful this average is to any prediction we make.

Given the model described by Bashash et al., (2017) explained only 3% of the IQ variance, while the standard error of the estimate was relatively large, it is misleading to suggest any “effect size” predicted by that model would be “highly significant” as this ignores the true variability in the reported data. When this is considered the effect size (and 95% CIs) is actually “5-6 ± 36 IQ points which is not statistically significantly different to zero IQ points,”

Remaining issues

I will leave these for now as they belong more to a critique of the paper itself (all published papers can be critiqued) rather than the misrepresentation of the paper by Mary Byrne and Paul Connett. Mary can always raise them again if she wishes.

So, to conclude, Mary Byrne is correct to say that the model derived by Bashash et al., (2017) predicts that an increase of “fluoride level in urine of 1 mg/L could result in a loss of 5-6 IQ points” – on average. But she is wrong to say this prediction is relevant to New Zealand, or anywhere else, because when we consider the data as a whole that loss is “5-6 ± 36 IQ points.”

I look forward to Mary’s response.

Similar articles

Paul Connett’s misrepresentation of maternal F exposure study debunked

Title slide for Paul Connett’s presentation to parliament

Anti-fluoride campaigners are misrepresenting a recent Mexican study claiming its findings should cause governments around the world to abandon community water fluoridation (CWF). Their claims are unwarranted because the study has a high degree of uncertainty. Activists are misrepresenting the accuracy of the studies findings. Because Mexico has areas of endemic fluorosis the study itself is not relevant to CWF.

Misrepresentation of the Mexican study was a central argument used by US anti-fluoride activist Paul Connett in his recent New Zealand speaking tour. This is shown in the Powerpoint presentation he prepared for his meeting at parliament buildings last month (see Anti-fluoride activist commits “Death by PowerPoint”).

It may have not been used in the end as only 3 MPs turned up. But, given his status in the anti-fluoride movement, this presentation will present the current strongest arguments against CWF. It is therefore worth critiquing his presentation whether it was given or not.

In this article, I will concentrate on Paul’s presentation of the Mexican study and may deal with other arguments used in the presentation in later articles. The paper reporting the study is:

Bashash, M., Thomas, D., Hu, H., Martinez-mier, E. A., Sanchez, B. N., Basu, N., … Hernández-avila, M. (2016). Prenatal Fluoride Exposure and Cognitive Outcomes in Children at 4 and 6 – 12 Years of Age in Mexico.Environmental Health Perspectives, 1, 1–12.

In Connett’s mind, the study’s results are so overwhelming we should immediately stop fluoridation throughout the world! This was the first and main argument he presented. His title slide and slide no. 10 introducing the study demonstrates the importance to him.

Slide No. 10 introducing Connett’s presentation of the Bashash et al (2017) study.

I have critiqued this study in previous articles – readers can find them at:

Fluoride, pregnancy and the IQ of offspring,
Maternal urinary fluoride/IQ study – an update,
Anti-fluoridation campaigners often use statistical significance to confirm bias and
Paul Connett “updates” NZ MPs about fluoride?

Paul is clearly aware of these articles because he included a note in his presentation about them. I am honoured (it is the only comment in the presentation) and pleased he has made an effort to engage with my critique.

This is what he says:

“Ken Perrott and those who follow him will claim that the wide degree of scatter in the data means the findings of this study are unreliable.  That is an incorrect interpretation of this graph and the study.  The effect size is very large (decrease by 5-6 IQ points per 1 mg/L increase in urine F) and is highly statistically significant.  The fact that urine F can only explain a small amount of the variation of IQ does not invalidate the finding.  Rather, it is a reflection that there are many other factors that affect IQ, most of which are essentially random with respect to F exposure.  For example, individual genetics plays a huge role in IQ (it explains 80% or more of variation in IQ), therefore it would not be possible for F to explain more than the small remaining portion of variation in IQ.  Most studies of other developmental neurotoxins like Pb and Hg find very similar low correlation coefficients, yet there is no debate that their findings are valid.”

This comment provides me with a basis for a more detailed discussion of his use of the study.

The small amount of variance explained

Connett acknowledges my point that the observed relationship with urinary fluoride can explain only a very small amount of the variation in IQ – only 3%. A bit hard to deny considering the high degree of scatter in the data which is obvious even in the slides Connett uses:

Slide 20 where Connett reproduces Fig 2 from the Bashash et al. paper.

But he claims that this:

“does not invalidate the finding. Rather, it is a reflection that there are many other factors that affect IQ, most of which are essentially random with respect to F exposure.”

Here he is, of course, referring to his own “finding” or conclusion – not the authors.

Notice his assumptions:

  • Other factors will be “essentially random with respect to F exposure,” and
  • The observed relationship will not be changed by the inclusion of these other factors.

Those are huge assumptions. And they are wrong.

Here is a relevant example illustrating the danger of such assumptions – the association between ADHD prevalence and extent of fluoridation observed by Malin & Till (2015). Their association was able to explain between 22% and 31% of the variance in ADHD, depending on the specific data used. Far more than the 3% for the Bashash et al., (2017) study.

Yet, when other risk-modifying factors were included, in this case, mainly altitude, the significant association with fluoridation disappeared. A model including altitude, but not fluoridation, explained 46% of the variability in ADHD (see Perrott 2017 and a number of articles in this blog).

In this case, the incidence of fluoridation was correlated with altitude – fluoridation was simply acting as a proxy for altitude in the Malin & Till (2015) association. So much for Connett’s assurance that other factors “are essentially random with respect to F exposure.”

Other studies have found an association between symptoms of fluorosis and cognitive deficiencies. Choi et al., (2015), for example, reported an association of child cognitive deficits with severe dental fluorosis, but not with water F concentration. But there is a relationship between fluoride exposure and fluorosis prevalence – ie. fluorosis is not random with respect to F exposure. If the health effects resulting from fluorosis are the prime cause of the cognitive deficiency, the inclusion of fluorosis incidence in the multiple regression could produce a model where there is a statistically significant association with fluorosis but not with fluoride expose. That is, the urinary fluoride values could be simply acting as a proxy of fluorosis incidence.

A similar non-random association of premature births and low birth weight could occur because these problems do occur in areas of endemic fluorosis. These could be two of the health issues related to fluorosis but fluoride intake may not be the prime cause (see Premature births a factor in cognitive deficits observed in areas of endemic fluorosis?).

Connett is completely wrong to assume that other risk-modifying factors not considered in the Bashash study would necessarily be random with respect to fluoride exposure. And he is wrong to assume that inclusion of these factors would not change the association of child IQ with mothers’ urinary fluoride reported in the paper.

Notably, the Bashash et al (2017)study did not include any measure of fluorosis as a risk-modifying factor – despite the fact that Mexico has areas of endemic fluorosis. I believe its consideration of gestation period <39 weeks or >39 weeks was inadequate (the normal average period is 40 weeks). The cutoff point for birth weight (3.5 kg) was also high.

The size of the IQ effect

We only have the data in the Bashash et al., (2017) study to go with here and the associations they report are valid for that data. But what about the calculations Connett makes from the reported association.

For example, Connett declares:

” The effect size is very large (decrease by 5-6 IQ points per 1 mg/L increase in urine F) and is highly statistically significant.”

Let’s test this claim – using the association represented in Fig 2 from Bashash, which is the figure Connett and other anti-fluoride activists are using (his slide 20 above).

Firstly, we need to calculate prediction intervals from the data (see Confidence and prediction intervals for forecasted values). The shaded region in the figure used by Connett (Fig 2 in Bashash et al., 2017) represents the confidence interval – the region where there is a 95% probability that a best-fit line for the data lies. The region for the prediction intervals is much larger and Connett may be confused because he has interpreted the confidence interval wrongly. Yet, the prediction intervals are the important measure when considering the effect size.

Here are my graphs for the confidence interval and the prediction interval using data I digitally extracted from the paper (see Maternal urinary fluoride/IQ study – an update).

Let’s consider the predicted values of “child IQ” for urinary F concentrations of 0.5 and 1.5 mg/L.

Urine F (mg/L) Predicted value Lower Higher
0.5 99.8 74.4 125.2
1.5 93.0 67.5 118.4

The prediction intervals are very large. This means the real value for “child IQ” at a urine F value of 0.5 mg/L has a 95% probability of being in the range 74.4 – 125.2. The corresponding range for a urine F concentration of 1.5 mg/L is 67.5 – 118.4. When Connett claims that an increase of 1 mg/mL in mother’s urinary F produces a drop of 5 – 6 IQ points he actually means a drop of 5 – 6 ± 26 IQ points which is not statistically significantly different to zero.

The best-fit line for the data may be statistically significant – but Connett is wrong to say this about his predicted effect of urinary F on child IQ. In fact, over the whole range of urinary F measured there is a 95% probability that IQ remains at 100.

Connett’s claim of a “highly statistically significant” effect size is completely false. If he had simply and objectively looked at the scatter in the data points he would not have made that mistake.

Comparing maternal urinary F levels to other countries

Connett makes an issue of the similarity of maternal urinary F levels found in this Mexcian study to levels found elsewhere. One is tempted to say – so what? After all, I showed above that his claim of a “highly statistically significant” drop in child IQ with increases in maternal urinary F is completely wrong.

He does compare the urine F levels reported by Bashash et al., (2017) with some New Zealand data (Brough et al., 2015) and finds them to be very similar. Interestingly, Brough et al., (2015) reported their urinary F values as indicating fluoride intakes were inadequate for the women concerned. They certainly did not indicate toxicity.

The comparison does highlight for me one of the inadequacies in the Bashash (2017) paper – the inadequate measurements of urinary F. Whereas Borough et al., (2015) used the recommended 24-hr urine collection technique, the data used by Bashash et al (2017) relied on spot rather than 24 hr measurements. These spot measurements were only made once or twice during the pregnancy of these women.

Yes, these were the only F exposure measurements Bashash et al., (2017) had to work with but they are far from adequate.

Conclusions

Paul Connett, as a leader of the anti-fluoridation movement, is completely wrong about the Bashash et al., (2017) study. It will not lead to the end of community water fluoridation throughout the world – nor should it.

He has attempted to ignore, or downplay, the high scatter in the data and the low explanatory power of the relationship between children’s IQ and maternal F exposure found in the study (only 3%). His denial that this relationship may disappear when other more important risk-modifying factors are included is also wrong – as other examples clearly show.

Connett’s presentation of a size effect (5-6 IQ points with a 1 mg/L increase in F exposure) as “highly statistically significant” is also completely wrong. In fact, this size effect is more like 5 – 6 ± 26 IQ points which is not significantly different to zero.

The misrepresentation of this study by Paul Connett and other anti-fluoridation activists demonstrates, once again, that their claims should never be accepted uncritically. This is just one more example of the way their ideological and commercial interests drive them to misrepresent scientific finding.

Similar articles