Tag Archives: Hirzy

Anti-fluoride authors indulge in data manipulation and statistical porkies

Darrell Huff & Irving Geis wrote a classic book – How to Lie With Statistics. They outline various ways data can be presented to give the wrong story. However, there is an even more naive use of statistics to misrepresent data – just declare that a relationship is statistically significant, don’t show any data or statistical analysis.

Unfortunately, many people are fooled by the use of those magical words – “statistically significant.”

I suppose the lay person could be excused – although it would pay even them to be a bit more sceptical about such claims. But it seems that even some “scientific” journals, or perhaps inadequate peer reviewers, can be fooled by those magical words. Here is an example in the paper by Hirzy et al., (2015) in the journal Fluoride. (Yes, I know, this journal is well known for its anti-fluoride stance and poor scientific quality but I would have thought the editor, Bruce Spittle,  would have picked this one up – even if they do not have an adequate peer review system. Perhaps the fact Spittle is one of the authors of the paper is a factor).

I critiqued the paper in my article Debunking a “classic” fluoride-IQ paper by leading anti-fluoride propagandists and have submitted a more formal critique to the journal (see – Critique of a risk analysis aimed at establishing a safe dose of fluoride for children.) But here I just want to deal with those magical words used in the paper – “statistically significant.”

Hirzy et al (2016) rely completely on data reported by Xiang et al., (2003) and claim they “found a statistically significant negative relationship between . . . .  drinking water fluoride levels and IQ.” Trouble is – you can search through the data presented by Xiang et al., (2003) and there is absolutely nothing to indicate a “statistically significant” relationship. Sure, that paper actually claims “This study found a significant inverse concentration-response relationship between the fluoride level in drinking water and the IQ of children.”  But there is no table or graphic presenting the individual data points and no statistical analysis for drinking water F and IQ. Rather surprising because Xiang et al., (2003) did present the individual data points for urinary fluoride and did present some results for statistical analysis of other relationships.

The trick behind the misleading use of Xiang’s data

However, what Xiang et al (2003) did do was separate their drinking water fluoride and IQ data into different ranges. This is a table of their result.

While group F was data for one village (Xinhuai) and the data in the other groups were for a separate village (Wamiao), there was no explanation of the criteria used for the groups – and the numbers in each group very tremendously. Over half the children (290 of the total 512) were in Group F and the size of the other groups seem to arbitrarily vary between 8 and 111.

This manipulation produces data which can be used to imply a statistically significant relationship. Do the statistical analysis for water F and IQ in the above table and sure you get a lovely straight line, a correlation of 0.96 and very significant statistically (p=0.003). But because of the manipulation, this says exactly nothing about the original data.

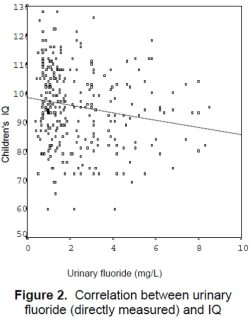
I will illustrate this by taking some data which Xiang et al (2003) did provide – for urinary fluoride and IQ. The data are illustrated in the figure below from the paper.

A statistical analysis of that data did show it was statistically significant – Xiang et al. (2003) cite a “Pearson correlation coefficient –0.174 , p = 0.003.” Now, that explains about 3% of the variance in IQ and I would have liked to see a similar analysis for water F as other workers have usually found weaker relationships for water F than for urinary F.

But let’s try using the manipulation of Xiang et al (2o03) and Hirzy et al (2016) to make the relationship between urinary F and IQ look a lot better than it is. I used a software tool to extract data from the figure – it didn’t extract all the points (264 out of a total 290) because of overlaps but statistical analysis of my extracted data gave a Pearson correlation coefficient of 0.16, p=0.010. Very similar to that reported by Xiang et al., (2003).

The tricky manipulations

I have absolutely no idea why Xiang et al., (2003) used different group sizes – so, to be fair, I have divided my extracted data into 6 groups of 44 pairs each (after sorting them into order based on urinary F) to produce the following table.

Urinary F IQ
A 1.79 105.57
B 2.30 89.45
C 2.30 77.72
D 2.69 68.58
E 2.48 56.25
F 2.69 40.10

This produces a lovely graph:

But, just a minute, I can get a better graph if I sort  the data according to IQ instead of urinary F:

But why stop there. If I choose different group sizes – remember Xiang et al., (2003) had groups ranging from 8 to 250 in size – I am sure I can get an even better presentation of the data.

TBut these graphs look far better than the one presented in Xiang et al (2003) for urinary F. We have taken data where the urinary F data explains only about 3% of the variance in IQ and produced graphics implying it “explains” up to about 75% of the variance. And we could “explain” more with a bit of extrra manipulation.

Conclusion

Data manipulation like this doesn’t change the fact that while the relationship between urinary F and IQ is statistically significant it only explains about 3% of the variance in IQ. This means that other factors, or confounders, should be considered – and when they are it is likely the significant relationship of IQ to urinary F would disappear.

Although Xiang et al., (2003) did not provide any statistical analysis to support their claim there was a significant relationship between water F and IQ I am sure the relationship is similar to that for urinary F – maybe even worse. Manipulating the data by using a range of groups of different sizes has certainly made the data look a lot better – but it is completely misleading.

I think it shocking that the authors of the Hirzy et al., (2016) paper have used manipulated data in this way – first to claim that fluoride in drinking water has a major negative effect on IQ and secondly to use such massaged data to work out a “safe dose.”

Worse, the journal Fluoride, and its peer reviewers, should never have accepted this paper without querying the claim of a significant relationship between drinking water F and IQ.

Similar articles


Debunking a “classic” fluoride-IQ paper by leading anti-fluoride propagandists

epa-meeting-sept5-2014

Three of the paper’s authors – Quanyong Xiang (1st Left), Paul Connett (2nd Left) and Bill Hirzy (far right) – preparing to bother the EPA.

Anti-fluoride groups and “natural”/alternative health groups and websites are currently promoting a new paper by several leading anti-fluoride propagandists. For two reasons:

  1. It’s about fluoride and IQ. The anti-fluoride movement recently decided to give priority to this issue in an attempt to get recognition of possible cognitive deficits, rather than dental fluorosis,  as the main negative health effect of community water fluoridation. They want to use the shonky sort of risk analysis presented in this paper to argue that harmful effects occur at much lower concentrations than currently accepted scientifically. Anti-fluoride guru, Paul Connett, has confidently predicted that this tactic will cause the end of community water fluoridation very soon!
  2. The authors are anti-fluoride luminaries – often described (by anti-fluoride activists) as world experts on community water fluoridation and world-class scientists. However, the scientific publication record for most of them is sparse and this often self-declared expertise is not actually recognised in the scientific community.

This is the paper – it is available to download as a pdf:

Hirzy, J. W., Connett, P., Xiang, Q., Spittle, B. J., & Kennedy, D. C. (2016). Developmental neurotoxicity of fluoride: a quantitative risk analysis towards establishing a safe daily dose of fluoride for children. Fluoride, 49(December), 379–400.

bruce-spittle

Co-author Bruce Spittle – Chief Editor of Fluoride – the journal of the International Society for Fluoride Research

I have been expecting publication of this paper for some time – Paul Connett indicated he was writing this paper during our debate in 2013/2014. FAN newsletters have from time to time lamented at the difficulty he and Bill Hirzy were having getting a journal to accept the paper. Connett felt reviewers’ feedback from these journals was biased. In the end, he has lumped for publication in Fluoride – which has a poor reputation because of its anti-fluoride bias and poor peer review. But, at last Connett and Hirzy have got their paper published and we can do our own evaluation of it.

The authors are:

david-c-kennedy

Co-author David C. Kennedy – past president of the International Academy of Oral Medicine and Toxicology – an alternative dentist’s group.

Bill Hirzy, Paul Connett and Bruce Spittle are involved with the Fluoride Action Network (FAN), a political activist group which receives financial backing from the “natural”/alternative health industry. Bruce Spittle is also the  Chief Editor of Fluoride – the journal of the International Society for Fluoride Research Inc. (ISFR). David Kennedy is a Past President of the International Academy of Oral Medicine and Toxicology which is opposed to community water fluoridation.

Quanyong Xiang is a Chinese researcher who has published a number of papers on endemic fluorosis in China. He participated in the 2014 FAN conference where he spoke on endemic fluorosis in China.

xiang-Endemic fluorosis

Much of the anti-fluoridation propaganda used by activists relies on studies done in areas of endemic fluorosis. Slide from a presentation by Q. Xiang to an anti-fluoride meeting organised by Paul Connett’s Fluoride Action Network in 2014.

Critique of the paper

I have submitted a critique of this paper to the journal involved. Publication obviously takes some time (and, of course, it may be rejected).

However, if you want to read a draft of my submitted critique you can download a copy from Researchgate – Critique of a risk analysis aimed at establishing a safe dose of fluoride for children.  I am always interested in feedback – even (or especially) negative feedback – and you can give that in the comments section here or at Researchgate.

(Please note – uploading a document to Researchgate does not mean publication. It is simply an online place where documents can be stored. I try to keep copies of my documents there – unpublished as well as published. It is very convenient).

In my critique I deal with the following issues:

The authors have not established that fluoride is a cause of the cognitive deficits reported. What is the point in doing this sort of risk analysis if you don’t actually show that drinking water F is the major cause of cognitive deficits? Such an analysis is meaningless – even dangerous, as it diverts attention away from the real causes we should be concerned about.

All the reports of cognitive deficits cited by the authors are from areas of endemic fluorosis where drinking water fluoride concentrations are higher than where community water fluoridation is used. There are a whole range of health problems associated with dental and skeletal fluorosis of the severity found in areas of endemic fluorosis. These authors are simply extrapolating data from endemic areas without any justification.

The only report of negative health effects they cite from an area of community water fluoridation relates to attention deficit hyperactivity disorder (ADHD) and that paper does not consider important confounders. When these are considered the paper’s conclusions are found to be wrong – see ADHD linked to elevation not fluoridation, and ADHD link to fluoridation claim undermined again.

The data used by the Hirzy et al. (2016) are very poor. Although they claim that a single study from an area of endemic fluorosis shows a statistically significant correlation between IQ and drinking water fluoride that is not supported by any statistical analysis.

The statistically significant correlation of IQ with urinary fluoride they cite from that study explains only a very small fraction of the variability in IQ values (about 3%) suggesting that fluoride is not the major, or maybe not even a significant, factor for IQ. It is very likely that the correlation between IQ and water F would be any better.

Confounders like iodine, arsenic, lead, child age, parental income and parental education have not been properly considered – despite the claims made by Hirzy et al. (2016)

The authors base their analysis on manipulated data which disguises the poor relations of IQ to water fluoride. I have discussed this further in Connett fiddles the data on fluorideConnett & Hirzy do a shonky risk assessment for fluoride, and Connett misrepresents the fluoride and IQ data yet again.

Hirzy et al. (2016) devote a large part of their paper to critiquing Broadbent et al (2014) which showed no evidence of fluoride causing a decrease in IQ  using data from the Dunedin Multidisciplinary Health and Development Study. They obviously see it as a key obstacle to their analysis. Hirzy et al (2016) argue that dietary fluoride intake differences between the fluoridated and unfluoridated areas were too small to show an IQ effect. However, Hirzy et al (2016) rely on a motivated and speculative estimate of dietary intakes for their argument. And they ignore the fact the differences were large enough to show a beneficial effect of fluoride on oral health.

Conclusion

I conclude the authors did not provide sufficient evidence to warrant their calculation of a “safe dose.” They relied on manipulated data which disguised the poor relationship between drinking water fluoride and IQ. Their arguments for their “safe dose,” and against a major study showing no effect of community water fluoridation on IQ, are highly speculative and motivated.

Similar articles


Connett & Hirzy do a shonky risk assesment for fluoride

Paul Connett, executive director of the Fluoridation Action Network (FAN), told me, during our fluoride debate, that he was writing a scientific paper defining a lower safety limit for fluoride than currently accepted. Nothing has been published yet – although a recent FAN newsletter did refer to a risk assessment paper by him and Bill Hirzy currently under review. I look forward to reading this paper, but I am not holding my breath as neither author has an impressive publication record.

Connett described his risk assessment for fluoride in the debate (see Fluoride debate: Paul Connett’s Closing statement) and he and Hirzy have also made comments on this lately. They are rejecting the current risk assessment, based on the incidence of severe dental fluorosis, and using the incidence of IQ deficits instead. To this end, they are heavily promoting the work of Choi et al., (2012) and Xiang et al., (2003) (which reported IQ deficits in areas where fluorosis is endemic). They are also attempting to rubbish published research (such as Broadbent et al., 2014) which show no significant IQ deficits at fluoride concentrations used in community water fluoridation.

Connett and Hirzy have also organised campaigns to congressional representatives in their effort to force a downward revision of the Environmental Protection Agency’s (EPA) standards for fluoridation.

Connett’s approach is a desk study – these guys are not going  to dirty their hands by doing their own research to get useful data. They are taking a value which they claim represent the lowest concentration of fluoride in drinking water below which no IQ deficit was found. They then apply “safety factors” to effectively conclude the only safe concentration is zero (see Scientist says EPA safe water fluoride levels must be zero)!

I will be a bit surprised if they manage to squeeze their paper though a decent review process because their approach is shonky. Look at the way they use the data from Xiang et al., (2003). (I have used the presentations by Connett and Hirzy at last February’s Sydney anti-fluoride conference as sources here). As I pointed out in Connett fiddles the data on fluoride, this data actually does not show a strong relationship between IQ and fluoride. The figure (from Xiang et al., 2003) shows the relationship between IQ and urinary fluoride and, in this case, the fluoride explains only about 3% of the variance in IQ.

Despite being statistically significant (p=0.003) this is certainly not evidence for a causative relationship. Clearly other, unconsidered, factors contribute to the variance and if these were considered the relationship with fluoride may be non-significant.

(Readers may notice the figure uses data for urinary not drinking water fluoride. Unfortunately, Xiang did not give a similar figure for fluoride concentration in drinking water. I have contacted him requesting the similar data for drinking water but so far have not had a meaningful response. Xiang did report drinking water fluoride is well correlated with urine fluoride so the above figure probably gives a good idea of the variability in drinking water fluoride as well).

Connett and Hirzy effectively ignore the high variability in the data and rely on a trick to get this  second graph. By splitting the concentration range into groups and taking the mean IQ for each group they make the situation look a lot more respectable. Who would guess from this trick that fluoride only explained about 3% of the IQ variance?
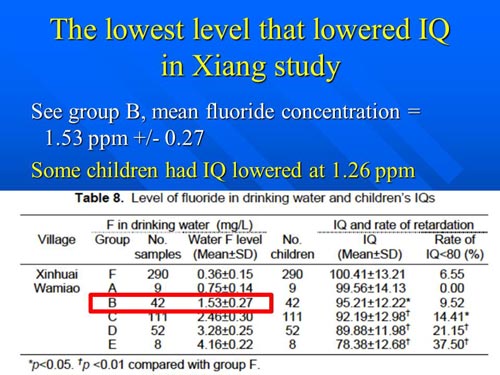
Connett illustrates his next step with this slide.

Sydney-Feb-21-key-step

He then claims that IQ deficits occur at a fluoride concentration of 1.26 ppm – he appears to have simply subtracted the value of one standard deviation from the mean of the lowest concentration group associated with a significantly different mean IQ to that of Xiang’s “control” group – Xinhaui village. That is strange because surely the first figure indicates  that low IQ values occur even for children with very low urinary fluoride, and most probably drinking water fluoride.

Connett then uses a safety factor of 10 (“to account for the wide range of sensitivity expected for any toxic substance in a large population”). Of course, this produces a maximum “safe” concentration of 0.13 ppm – which rules out all fluoridated water – and most natural water sources!

Sydney Feb 21 B Australia,  2015Connett goes on to promise his offsider, Bill Hirzy, will elaborate on the method they issued. Hirzy’s presentation did mention fluoride intake from other sources besides water. He then presents his conclusion on what the “safe daily dose” is fluoride – but no explanation of why! All the preceding slides in his presentation where self-justifying descriptions of his qualifications, employment history and how great his organisation, FAN, is.

IQ-Risk-Assessment-02.26.15

Conclusions

Connett and Hirzy are claiming IQ deficits are more important than dental fluorosis for setting of maximum fluoridation levels in drinking water. They are campaigning to get this accepted by legislators and the EPA.

Connett has been promising publication in a scientific journal for several years and recently implied that a paper is under review. If their publication efforts are successful a more critical assessment of their approach will be possible.

Available information indicates Connett and Hirzy have no original data but are relying on data from a study of children in an area of endemic fluorosis in China. They are refusing to accept published information from areas where community water fluoridation exists.

Their analysis also appears to rely on a tricky processing of the data to obscure the fact that fluoride probably only explains about 3% of the variance in IQ measured by the Chinese researchers! Legislators and policy makers would be foolish indeed to make changes to fluoridation standards on the basis of such data and poor analysis.

I could, of course, be wrong so eagerly await the Connett & Hirzy (2016?) paper.

Similar articles

Connett fiddles the data on fluoride

I am always suspicious when activists present simple figures to confirm their bias and fool their audience. I think anti-fluoride activists do this a lot. Here is an example in Paul Connett’s presentation to the recent Sydney anti-fluoride conference.

Connett uses data from Xiang et al (2003) and some of Xiang’s other papers and presentation to push his claim that fluoridation is bad for your IQ. Apparently he and Bill Hirzy (currently described as Fluoride Action Networks “chemist in residence”) are working on a paper attempting to justify a case that the maximum permissible level of fluoride in drinking water should be reduced to practically zero! They use a simplification of data from Xiang’s paper for this.

Xiang-2003

First of all the figure shows what Xiang’s data is like. It compares IQ with urine fluoride concentration – unfortunately he did not give a similar figure for fluoride concentration in drinking water. However, this is well correlated with urine fluoride.

There is certainly a lot of scatter, but Xiang (2003) reports a “Pearson correlation coefficient of 0.174, p=0.003.” So a statistically significant relationship (helped by having a large number of samples) but it still only explains about 3% of the variance!

This is important because, although Xiang did consider some confounding factors he could well have missed a factor which explains more of the variance which, when considered, may make the relationship with serum fluoride concentration non-significant. For example, I would be interested to see a statistical analysis which included incidence of moderate and severe dental fluorosis as this may be more important than the drinking water fluoride concentration itself).

Connett-sydneyBut have a look at how Paul Connett present this data (or the equivalent data for drinking water fluoride concentration) in his Sydney anti-fluoride conference presentation.

The “trick” has been to divide the data into “categories” based on inclusion in a separate water fluoride concentration ranges and then presenting only the averages within each category. I can see the point of sometimes using such categories, but this figure conveys a very misleading message.

The Sydney audience could have been excused for thinking that Xiang’s data showed a very strong connection between IQ and drinking water fluoride – a relationship explaining almost all the variance. Completely misleading as this relationship probably only explains only about 3% of the variance in the original data.

Paul Connett and William Hirzy are currently campaigning to make IQ the key factor for determining the maximum permissible levels of fluoride in drinking water. They might confuse a few politicians with these sort of distortions but hopefully the real decision-makers will be awake to such tricks.It really is

It really is a matter of “the reader beware.” Never take on trust what these political activists are saying. Always go to the original sources and consider them critically and intelligently.

Similar articles

Astro-turfing for scientific credibility

In my article Anti-fluoridation study flawed – petition rejected  I referred to Bill Hirzy’s flawed paper, Hirzy et al. (2013)on fluoridation chemicals. He has now submitted a correction to this paper. Interested readers can see it at  Corrigendum to “Comparison of hydrofluorosilicic acid and pharmaceutical sodium fluoride as fluoridating agents—A cost–benefit analysis” [Environ. Sci. Policy 29 (2013) 81–86].

Hirzy does admit to embarrassment for the major mistake in his calculations. However, he doesn’t hold back on his political line. He concludes that his arguments for making bottled water fluoridated with NaF available is:

“an economically and socially feasible alternative to putting industrial grade HFSA into 100 gallons per day per capita and flushing more that 98 percent of that into municipal waste water treatment plants. Of course the phosphate industry would have to find some other means of dealing with 250,000 tons per year of HFSA than shipping it from their factories to drinking water treatment plants, passing it through households and into waste water treatment plants.”

Well, I guess he is primarily a political activist (this paper and its correction seem to be the total of his scientific publication list).

American Environmental Health Sciences

However, I was interested to see his contact details given in the paper as: “American Environmental Health Sciences, 506 E Street, N.E., Washington, DC 20002, USA.” I wondered, who the hell is the American Environment Health Science organisation, so did an internet search. Try it and see if you can find out anything more than I did.

Sum total was 2 links. One to a Chinese Hardware Co which referred to:

” American Environmental Health Sciences researcher One study found that 99 percent of American families with dogs and cats allergens, but only less than half of which the family cat or dog . Most of the family pet allergens from schools, hospitals , shopping malls , cinemas and other public places .”

Not much sense there.

The other was to a conference programme (The Middle East Waste Summit 2009). One of the speakers (our old friend Paul Connett) was described as “Director, American Environmental Health Science Projects.” Not as coincidental as one might think – Bill Hirzy works for Paul Connett’s Fluoride Action Network as a paid political lobbyist.

Still – how credible is this organisation. A search of its postal address showed it to be a residential house in Washington. In fact, it seems to be the house in which Bill Hirzy lives!

My conclusion – another astroturf organisation with a sciency name used to give some sort of credibility to Bill Hirzy and Paul Connett. I know the anti-fluoridation movement has a track record in setting up astro-turf organisations for this sort of purpose (see my article Anti-fluoridationist astro-turfing and media manipulation). But I wonder how widespread this practice is for supplying credibility in scientific journals and conferences?


Note: A reader brought to my attention that the address for the International Society for Fluoride Research Inc., publisher of the Fluoride journal, is 727 Brighton Road, Ocean View, Dunedin 9035. Another residential address.

By the way the  International Society for Fluoride Research Inc. is registered in New Zealand as a charity where you can view details of its rules and financial reports.

Similar articles

Anti-fluoridation study flawed – petition rejected

A recent research paper claiming a signficant cost/benefit advantage in banning the use of fluorosilicic acid as a fluoridating agent in public water treatment, and replacing it with sodium fluoride, has been found flawed. This was revealed as a result of the rejection by the US Environmental protection Agency (EPA) of a petition by the author

dr-william-hirzy-phd-370x277

Dr William Hirzy testifies for an anti-fluoridation group

The original paper by Hirzy et al. (2013) is on-line – full details are Hirzy, J.W., Carton, R.J., Bonanni, C.D., Montanero, C.M., Nagle, M.F. (2013) Comparison of hydrofluorosilicic acid and pharmaceutical sodium fluoride as fluoridating agents—A cost–benefit analysis  J Environmental Science and Policy Volume 29, May 2013, Pages 81–86.

Briefly the authors had used data (arsenic (As) concentrations in a number of samples of fluorosilicic acid and sodium fluoride) and a model for the predicted incidence of cancers resulting from As contamination in water supplies. Their cost/benefit analysis claimed “the U.S. could save $1 billion to more than $5 billion/year” by using pharmaceutical grade sodium fluoride instead of fluorosilicic acid.

Consequently Hirzy petitioned the EPA to ban use of fluorosilicic acid, using his study as supporting evidence. The EPA responded officially on August 6 and, despite some of the legalese, their notice is worth reading for anyone interested in the fluoridation controversy.

A calculation error for arsenic

When I first read Hirzy’s paper I was concerned that the quoted values for As in the fluorosilicic acid samples he considered were higher than found in New Zealand. (As concentrations in local fluorosilicic acid for water treatment are about the same as for the pharmaceutical garde sodium fluoride he used). I wondered if his data was out of date, or he had used commercial grade samples and not water treatment samples. However, the EPA found a more basic fault – Hirzy’s calculations were wrong! They had “failed to convert their estimates of lifetime cancer risk to estimates of annual cancer risk for the purpose of calculating annual net benefits.” When corrected the cost benefit analysis favoured fluorosilicic acid “(-$81M/year to -$8M/year, respectively) rather than pharmaceutical grade NaF over HFSA:”

1. Arsenic. EPA evaluated the cost-benefit analysis submitted by the petitioners and determined that the petitioners miscalculated net benefits for pharmaceutical grade NaF compared to HFSA. Specifically, it appears that the petitioners failed to convert their estimates of lifetime cancer risk to estimates of annual cancer risk for the purpose of calculating annual net benefits. This error alone results in a 70-fold overestimation of the number of annual cancer cases due to arsenic. That is, for the analysis in which the petitioners evaluate arsenic concentrations of 0.078 parts per billion (ppb) due to HFSA and 0.00084 ppb due to pharmaceutical grade NaF, the estimated numbers of cancer cases, when corrected, decrease from 320 to 4.6 per year for HFSA and from 3.4 to 0.05 per year for pharmaceutical grade NaF (Refs. 2 and 9). Similarly, for the analysis in which the petitioners evaluate an arsenic concentration of 0.43 ppb due to HFSA and 0.00084 due to pharmaceutical grade NaF, the estimated numbers of cancer cases,  when 8 corrected, decrease from 1,800 to 25 per year for HFSA and from 3.4 to 0.05 per year for pharmaceutical grade NaF (Refs. 2 and 9). After making the correction (i.e., annualizing the lifetime cancer risk), and retaining all other assumptions of the petitioners analysis, the analysis actually indicates that the cost-benefit ratio is in favor of using HFSA over pharmaceutical grade NaF (-$81M/year to -$8M/year, respectively) rather than pharmaceutical grade NaF over HFSA (Ref. 9). As a result, the information submitted by petitioners does not support the petitioners’ claim that there are net benefits in switching from HFSA to pharmaceutical grade NaF. Given that the petition is based upon the premise that the benefits of using pharmaceutical grade NaF as a fluoridation agent significantly exceed the costs relative to the use of HFSA as a fluoridation agent, EPA concludes that petitioners have not set forth sufficient facts to establish that HFSA presents or will present an unreasonable risk of injury to health or the environment with respect to arsenic or that it is necessary to initiate a TSCA section 6(a) rulemaking to protect adequately against such risk.

Lead risk not proved

The EPA similarly found that Hirzy’s claim that fluorosilicic acid caused leaching of lead from pipes in the water supply system was similarly unproved”

2. Lead. Petitioners assert that HFSA contains lead but provided no data to support this assertion. Petitioners also assert that the use of HFSA in lead-containing water piping systems results in leaching of lead from lead-containing water piping systems into water (Ref. 5), and that when chloramine is used in conjunction with silicofluorides greatly enhanced leaching of lead into water occurs (Ref. 3). . . . .  Based on the available evidence, EPA cannot conclude that the use of HFSA, with or without the presence of chloramine, results in enhanced leaching of lead.

Radioactive contaminants

Again the EPA found that Hirzy’s claims about radionuclide contamination were not supported:

4. Radionuclides. Although the petitioners mention “concern” about radionuclides, the petitioners present limited information to support a claim that HFSA presents or will present and unreasonable risk with respect to radionuclides. NSF compiled data from initial and annual monitoring tests for fluoridation products that NSF certified to NSF/ANSI 60 between 2007 and 2011 (216 samples) and between 2000 and 2006 (245 samples). Alpha emitters (type of radioactive decay in which an atomic nucleus emits an alpha particle) were detected in less than 1% of the 216 samples analyzed between 2007 and 2011. The mean (non-detects were estimated at ½ the detection limit) and maximum values were less than the MCL of 15 picoCuries per liter (pCi/L) and were less than the NSF/ANSI 60 SPAC of 1.5 pCi/L (Ref. 15). Beta photon emitters (another type of radioactive decay in which an atomic nucleus emits a beta particle) also were detected in less than 1% of the 216 samples analyzed between 2007 and 2011. The mean (non-detects were estimated at ½ the detection limit) and maximum values were less than the MCL of 4 millirems per year (mrem/y) and were less than the NSF/ANSI 60 SPAC of 0.4 mrem/y (Ref. 15). Radionuclides (alpha or beta) were not detected in any (0%) of the 245 samples analyzed between 2000 and 2006 (Ref. 11). The concentrations reported represent contaminant levels expected when the fluoridation products are dosed into water at the allowable maximum use levels for NSF/ANSI 60- 2012 (see Refs. 14 and 15). NSF notes that lower product use levels would produce proportionately lower contaminant concentrations. Thus, the petition has failed to present facts that establish that HFSA presents or will present an unreasonable risk of injury to health or the environment with respect to radionuclides, or that it is necessary to issue a TSCA section 6 rulemaking to protect health and the environment from such risk.

So, it would be nice if anti-fluoridationists would stop using Hirzy’s paper to “prove” that use of fluorosilicic acid causes cancer when used as a fluoridating agent. Or better still, stop promoting the lie that such fluoridating agents contaminate our drinking water with toxic heavy metals and radioactive elements.

But, going by past practice I am not going to hold my breath.

Similar articles on fluoride and fluoridation