
This is the second article in a series critiquing contributions to the Fluoride Free NZ report “Scientific and Critical Analysis of the 2014 New Zealand Fluoridation Report.”
My first article Peer review of an anti-fluoride “peer review” discussed Kathleen Theissen’s contribution. (It also discussed a draft contribution by Chris Neurath which does not appear in the final version).
I will shortly post a 3rd article discussing H. S. Micklem’s contribution.
See The farce of a “sciency” anti-fluoride report for an analysis of the close relationships between the authors and peer reviewers of the Fluoride Free report and anti-fluoride activist groups.
There is a lot in Stan Litras’s article to criticise – there is a lot which is misleading or outright wrong. I hope Stan will seriously consider my criticisms and respond to them, especially where he thinks I am wrong.
My criticisms should also be considered by Bruce Spittle and Hardy Limeback who Fluoride Free NZ listed as “peer reviewers” of Stan’s article. They must bear some responsibility for allowing the article to go ahead without the necessary corrections.
Litras makes many of his criticisms of community water fluoridation (CWF) in passing – without argument or evidence. But he declares:
“My comments will focus on the gross over statement of the purported benefits of fluoridation in our society, New Zealand, 2014.”
So, I will start with the claims he makes on this.
“Overseas studies” – The WHO data
Central to this are Stan’s assertions:
“The “elephant in the room” is that while decay rates fell in areas where fluoridation was implemented, it also fell in areas that weren’t, often at a faster rate. (8)”
And
“Globally, fluoridation is seen to make no difference to reduced decay rates, there being no difference between the few countries which use artificial fluoridation, and those that don’t. (8,7)”
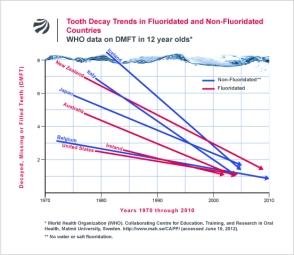 His only evidence for this is a figure prepared by Chris Neurath from the Fluoride Action Network – using data from the World Health Organisation (WHO). Here it is in a slightly simpler version to the one used by Stan.
I am amazed that anti-fluoride propagandists keep using this graphic as “proof” that fluoride is ineffective. But they do – which can only mean they haven’t thought it through.
While the plots do show improvements in oral health for countries independent of fluoridation they say nothing about the effect of fluoride. Simple comparison of countries obscures all sorts of effects such as differences in culture, history, social and political policies, etc. Such plots are also influenced by changes and differences in dental treatment and measurement techniques.
Robyn Whyman in his report “Does delayed tooth eruption negate the effect of water fluoridation?“ exposes the little trick Stan is trying to pull with the WHO data:
“Studies that appropriately compare the effectiveness of water fluoridation do not compare poorly controlled inter-country population samples. They generally compare age, sex, and where possible ethnicity matched groups from similar areas. Inter-country comparisons of health status, including oral health status, are notoriously difficult to interpret for cause and effect, because there are so many environmental, social and contextual differences that need to be considered.”
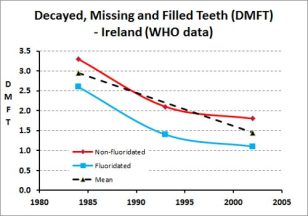 There are some within country data within the WHO data set Neurath used which can give a better idea of the beneficial effects of fluoridation. This plot shows the results for the WHO data for Ireland. A clear sign that fluoridation plays a beneficial role.
Neurath covered up evidence for the benefits of CWF by simply using the mean of fluoridated and unfluoridated areas for countries like Ireland and New Zealand. Also, the straight lines in Chris Neurath’s plots are a real give away to the poor quality of the data used. Two data points for each country!
New Zealand – Cherry-picking the MoH data
I have criticised Stan’s misrepresentation the Ministry of Health (MoH) data before. At the time he was using and misrepresenting some of my own graphics on his business website. He has since removed the offending article but now he returns with a vengeance – with tables and figures of his own.
This has given him free hand to cherry-pick and misrepresent to his heart’s content.
He claims:
“Ministry of Health figures recorded every year in 5 year olds and year 8s (12-13 year olds) consistently show minimal or no differences between fluoridated and nonfluoridated areas of NZ.”

Cherry-picked data from Stan Litras
And he backs this up with a graph.
That looks about right. The data for 2011 shows 59.9% of 5 year olds in fluoridated areas were caries-free while 59.2% were carries free in non-fluoridated areas. No real difference.
But come on! A single data point, one year, one of the age groups for the fluoridated and unfluoridated areas! That is blatantly cherry-picking – as I mentioned in my article Cherry picking fluoridation data. In that I presented all the data for 5 year olds and year 8s, and for the total population and Maori, and for % caries free and decayed, missing and filled teeth (DMFT).
I have reproduced this data here in a simpler form using several figures.
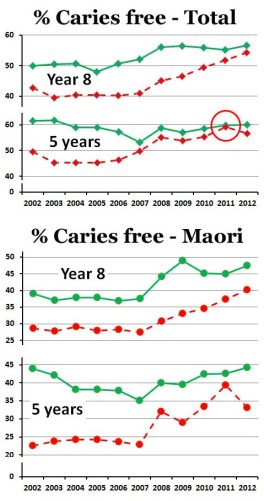 Considering the % caries free data there are several points:
1: These do not “consistently show minimal or no differences between fluoridated and nonfluoridated areas” as Stan claims.
2. They do show a decline in differences between fluoridated and non-fluoridated areas in recent years.
3: This trend is less obvious for Maori but still present.
4: Stan has blatantly cherry-picked the data points for 5 year-olds in 2011 to give him the least possible difference (see red circle in figure).

The data for decayed, missing and filled teeth (DMFT) shows similar trends.
Presumably both measures (% caries free and DMFT) are useful indicators of oral health but they probably convey complementary and not exactly the same information.
I discussed features of the graphs and their trends in in my articles Cherry picking fluoridation data and Fluoride debate: Response to Paul’s 5th article where I also discussed limitations in the data.
We need to appreciate this is just normal school clinic data, without technique standardisation for those making the measurements or proper recording of place of residence. The latter effect probably shows up more strongly after 2004 when a “hub and spoke” dental clinics system was introduced further confusing proper records of likely fluoride intake. One school dental clinic could serve a number of areas – both fluoridated and non-fluoridated. This mixing is a likely explanation for the apparent decline of the effectiveness of fluoridation after 2006.
So, yes, the MoH data is not straightforward. But this means it should be considered sensibly, taking into account its limitations and the social factors involved. Instead, Stan has leapt in – found the data points which best fit his own biases and then tried to claim those data are representative when they aren’t.
Stan presented another self-prepared graphic using data for the 4 different regions for 5-year-olds (see his page 27). He appears not to have used the correct data – at least for the Northern and Southern regions. My own graphic for this shows differences to his. (Of course, the mistake may be mine – if Stan can show I am wrong I will happily delete this part from my critique).
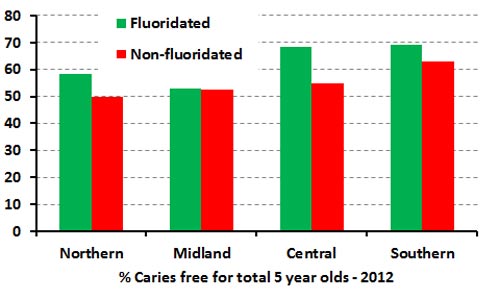
Again, that data should also not just be considered at face value – or selected to confirm a bias. It has limitations. For example in this case there were only 55 children in the fluoridated Southern region compared with 7568 in the non-fluoridated area. A footnote on the data sheet says:
“2. Excludes Southern DHB because data were not reported for 1 Jan-20 Feb 2012, and fluoridation status was not captured for most children throughout 2012, due to transition to a new data system. “
Proper consideration of such data must take these sort of limitations into account. But of course all Stan Litras did was select data to support his assertions and ignore the rest. Any limitations in the data did not concern him.
Lifetime benefit
Stan has a thing about the “lifetime benefits,” or lack of benefits, of CWF. Most studies of CWF have used data for children – data for adults is less common but there is still research literature on this available.
But all Stan did on this was to cherry-pick a graphic (Figure 53) from the NZ Oral Health Survey showing no significant change in DMFT for 65-74 year olds between the years 1976, 1988 and 2009. He then claims:
“Data from the NZOHS 2010 do not support statements of a lifetime benefit, indicating that the action of fluoride is simply to delay the decay. (13)”
But he has had to work hard to avoid other data like that in Figure 49 below which do show a significant improvement in the number of retained teeth of that age group. The Oral Health Survey report itself says:
“In dentate adults aged 65–74 years, the mean number fell from 17.1 to 12.1 missing teeth per person on average from 1976 to 2009.”

Again, instead of cherry-picking, searching for an image to fit his story, Stan should have considered the data and figures critically and intelligently. Perhaps the DMFT data does not show what he claims because more teeth have been retained in recent years. The decline in missing teeth could have been balanced by increases in fillings due to increase in remaining teeth. The lack of a significant difference in DMFT actually suggests the opposite to what he claims.
Litras also misrepresent the York review on the question of benefits from CWF for adults. He says:
“The York Review found there was no weight of evidence to support benefit in adults or in low SES groups, or increase of decay in cessation studies. (7)”
Just not true. The York report says:
“One study (Pot, 1974) found the proportion of adults with false teeth to be statistically significantly greater in the control (low-fluoride) area compared with the fluoridated area.”
Sheiham and James (2014) stressed that a proper assessment of oral health problems should include data for adults as well as children. Recent research is starting to take up this issue. For example O′Sullivan and O′Connell (2014) recently showed that water fluoridation provides a net health gain for older Irish adults.
Systemic vs topical
Stan promotes the common mythology of the anti-fluoridation propagandist that any mechanism for a beneficial effect of fluoride in restricting tooth decay is purely “topical.” He claims:
“It has been widely accepted since the 1990s that any effect on tooth decay from swallowing fluoride is insignificant or non-existent. To quote: CDC 1999: “the effect of Fluoride is topical “ (5); J Featherstone 1999: “the systemic effect is, unfortunately, insignificant” (6).”
Let’s consider what the sources Stan cites actually do say. I will quote from the 2001 edition of Stan’s citation 5 which he (partly) cites on page 36:
“Fluoride works to control early dental caries in several ways. Fluoride concentrated in plaque and saliva inhibits the demineralization of sound enamel and enhances the remineralization (i.e., recovery) of demineralized enamel (12,13 ). As cariogenic bacteria metabolize carbohydrates and produce acid, fluoride is released from dental plaque in response to lowered pH at the tooth-plaque interface (14 ). The released fluoride and the fluoride present in saliva are then taken up, along with calcium and phosphate, by demineralized enamel to establish an improved enamel crystal structure. This improved
structure is more acid resistant and contains more fluoride and less carbonate (12,15–19 ) (Figure 1). Fluoride is more readily taken up by demineralized enamel than by sound enamel (20 ). Cycles of demineralization and remineralization continue throughout the lifetime of the tooth.”

And
“Saliva is a major carrier of topical fluoride. The concentration of fluoride in ductal saliva, as it is secreted from salivary glands, is low — approximately 0.016 parts per million (ppm) in areas where drinking water is fluoridated and 0.006 ppm in nonfluoridated areas (27 ). This concentration of fluoride is not likely to affect cariogenic activity. However, drinking fluoridated water, brushing with fluoride toothpaste, or using other fluoride dental products can raise the concentration of fluoride in saliva present in the mouth 100-to 1,000-fold. The concentration returns to previous levels within 1–2 hours but, during this time, saliva serves as an important source of fluoride for concentration in plaque and for tooth remineralization (28 ).”
(Note: Stan simply quotes the first part of this statement (in red) in his article (page 36) and completely omits the second part (in black) – presumably because he wants to deny a role for fluoridated water in influencing the saliva fluoride concentrations. This cherry-picking of the CDC statement is typical for anti-fluoride propagandists – see Fluoridation – topical confusion).
There is an attempt to confuse a “topical” or “surface” mechanism with a “topical” application (eg toothpaste or dental treatments). However, fluoride is transferred to saliva from food and drink during ingestion so that ingested fluoride also contributes to the “topical” or “surface” mechanism.
However Stan wants to deny a “topical” role for ingested fluoride and claims (page 36):
“The required elevation of baseline levels only occurs after using fluoridated toothpaste or mouth rinse, a concentration of 1,000 ppm or more instead of 1 ppm from water.(24)”
His citation 24 is to Bruun (1984) and he misrepresents that paper which actually said:
“It was concluded that direct contact of the oral cavity with F in the drinking water is the most likely source of the elevated whole saliva fluoride and that the increased availability of fluoride in the oral fluids has an important relationship to the reduced caries progression observed in fluoridated areas.”
Systemic role.
Featherstone does say:
“Fluoride works primarily via topical mechanisms which include (1) inhibition of demineralization at the crystal surfaces inside the tooth, (2) enhancement of remineralization at the crystal surfaces (the resulting remineralized layer is very resistant to acid attack), and (3) inhibition of bacterial enzymes. Fluoride in drinking water and in fluoride-containing products reduces tooth decay via these mechanisms. Low but slightly elevated levels of fluoride in saliva and plaque provided from these sources help prevent and reverse caries by inhibiting demineralization and enhancing remineralization. The level of fluoride incorporated into dental mineral by systemic ingestion is insufficient to play a significant role in caries prevention. The effect of systemically ingested fluoride on caries is minimal.”
There is some debate over the role of systemic fluoride exuded by salivary glands. Many feel the concentration is too low – but because its effect is also determined by the presence of calcium, phosphate, organic species and pH it is best not to be dogmatic about this. It is, anyway, difficult to separate salivary fluoride derived from transfer from food and beverage in the oral cavity from that exuded by the salivary glands from systemic sources.
Stan is determined to deny a role for systemic fluoride during tooth development asserting:
“the erroneous theory that fluoride incorporated into children’s developing tooth enamel would make teeth more resistant to decay.”
While often neglected because of the concentration on surface mechanisms with existing teeth the theory that fluoride is incorporated into the developing teeth of children and confers a degree of protection is far from erroneous.
Newbrun (2004), for example, stressed in a review of the systemic role of fluoride and fluoridation on oral health:
“The role of systemic fluoride in caries prevention is neither “minimal” nor “of borderline significance.” On the contrary, it is a major factor in preventing pit and fissure caries, the most common site of tooth decay. Maximal caries-preventive effects of water fluoridation are achieved by exposure to optimal fluoride levels both pre- and posteruptively.”
Cho et al (2014) presented data showing that children exposed to CWF during teeth development retained an advantage over those never exposed to it even after fluoridation ceased.
Let’s stop confusing the issue. Systemic fluoride may not play a role with existing teeth but it does during tooth development – even if the relative contributions of systemic fluoride and “topical” or surface fluoride to lasting oral health are difficult to determine.
Tooth eruption delays
Stan resorts to special pleading when he claims with reference to NZ MoH data:
“Small apparent differences could be accounted for by other factors such as delayed eruption of teeth in fluoridated communities, therefore less time in the mouth exposed to plaque acids, ethnic distribution and urban/rural differences.”
He relies on the “York review” (McDonagh et al., 2000) to back up his “delayed tooth eruption” excuse:
“Importantly, the York Review noted that the variation of tooth eruption times between fluoridated and unfluoridated areas was not taken into account. (7)”
But that review actually said on this subject:
“It has been suggested that fluoridation may delay the eruption of teeth and thus caries incidence could be delayed as teeth would be exposed to decay for a shorter period of time. Only one study compared the number of erupted teeth per child. The difference was very small and in opposite directions in the two age groups examined, however no measure of the statistical significance of these differences was provided. Only one of the studies attempted to control for confounding factors using multivariate analysis (Maupomé 2000).”
Robyn Whyman has gone into this claim in more detail in his report “Does delayed tooth eruption negate the effect of water fluoridation?“ Here he critiques Paul Connett’s reliance on this excuse and concludes from his review of the literature:
“The studies and reports cited by Professor Connett to try and validate an argument for delayed tooth eruption either do not make the claims he suggests, or do not have direct relevance to trying to assess the issue. The claimed association is at odds with the published literature which indicates minimal variation in eruption time of permanent teeth by exposure to fluoride. A rational explanation exists for the minimal variations that have been reported based on the relationship between fluoride exposure, caries experience in the primary teeth and emergence timing for the permanent teeth.”
The “delayed tooth eruption” excuse is nothing more than special pleading and straw clutching.
Socio-economic factors
Stan again misrepresented the York review regarding socio-economic effects on oral health and the effectiveness of CWF when he claimed “there was no weight of evidence to support benefit in adults or in low SES groups.” The York review actually said:
“Studies should also consider changes in social class structure over time. Only one included study addressed the positive effects of fluoridation in the adult population. Assessment of the long-term benefits of water fluoridation is needed.”
And
“Within the UK there is a strong social gradient associated with the prevalence of dental caries. This is found both in adults and in children. Those who are more deprived have significantly greater levels of disease. There is also geographical variation with the northwest of England, Scotland and Northern Ireland most severely affected. (Pitts, 1998; Kelly, 2000)”
There have been a range of studies internationally showing that fluoridation can aid in reducing differences in oral health due to socio-economic effects. See for example Cho, et al., (2014).
What happens when fluoridation is stopped
Stan briefly refers to this issue, citing (as anti-fluoridation activists always do) Künzel and·Fischer (2000). I will simply refer him, and interested readers to my article What happens when fluoridation is stopped? This boils down to the need to read the scientific literature properly as usually the anti-fluoridation activists ignore the details referring to fluoride treatments and procedures which replaced CWF.
There are a number of other points mentioned briefly by Stan Litras which could be discussed but this article is already too long so I will leave that to the comments section.
Conclusions
Stan Litras has simply indulged in blatant cherry-picking of data, and misrepresentation of the literature, in his critique of the recent review Health Effects of Water Fluoridation: a Review of the Scientific Evidence produced by the Royal Society of NZ together with the Office of the Prime Minister’s Chief Science Advisor. Perhaps we shouldn’t expect better from a political activist in the anti-fluoride movement but he, and Fluoride Free NZ, attempt to present this, and other articles in the collection, as objective and scientifically credible. It is neither – such cherry-picking and misrepresentation violates any scientific ethics and needs to be exposed for what it is. The Fluoride Free NZ claimed “peer reviewers,” Bruce Spittle and Hardy Limeback, must share responsibility because, by their endorsement, they signal their approval of such behaviour.
Note
I offered Stan Litras a right of reply to this post, or even an ongoing exchange with him along the lines of my debate with Paul Connett. He replied:
“I look forward to your comments on my review, as a lay person, but I cannot engage in a serious dialogue with someone who is not a peer with the same level of knowledge as myself in the dental field. “
Hopefully this means he will at least comment here, take issue with me where he thinks I am wrong and correct me where I am mistaken. I also hope than Bruce Spittle and Hardy Limeback will also take advantage of their right to comment here.
References
Bruun, C., & Thylstrup, A. (1984). Fluoride in Whole Saliva and Dental Caries Experience in Areas with High or Low Concentrations of Fluoride in the Drinking Water. Caries Research, 18(5), 450–456.
Centers for Disease Control and Prevention. (2001). Recommendations for Using Fluoride to Prevent and Control Dental Caries in the United States (Vol. 50, p. 50).
Cho, H.-J., Jin, B.-H., Park, D.-Y., Jung, S.-H., Lee, H.-S., Paik, D.-I., & Bae, K.-H. (2014). Systemic effect of water fluoridation on dental caries prevalence. Community Dentistry and Oral Epidemiology.
Cho, H.-J., Lee, H.-S., Paik, D.-I., & Bae, K.-H. (2014). Association of dental caries with socioeconomic status in relation to different water fluoridation levels. Community Dentistry and Oral Epidemiology.
Fluoride Free New Zealand. (2014). Scientific and Critical Analysis of the 2014 New Zealand Fluoridation Report.
Künzel, W.;·Fischer, T. (2000). Caries Prevalence after Cessation of Water Fluoridation in La Salud, Cuba. Caries Res, 34, 20–25. Retrieved from http://www.karger.com/Article/Fulltext/16565
McDonagh, M., Whiting, P., Bradley, M., Cooper, J., Sutton, A., & Chestnutt, I. (2000). A Systematic Review of Public Water Fluoridation.
Ministry of Health. (2010). Our Oral Health Key findings of the 2009 New Zealand Oral Health Survey. Wellington, Ministry of Health.
Ministry of Health (2014) Age 5 and Year 8 oral health data from the Community Oral Health Service. http://www.health.govt.nz/nz-health-statistics/health-statistics-and-data-sets/oral-health-data-and-stats/age-5-and-year-8-oral-health-data-community-oral-health-service.
National Fluoridation Information Service (2011): Does Delayed Tooth
Eruption Negate The Effect of Water Fluoridation? National Fluoridation Information Service Advisory June 2011, Wellington, New Zealand.
O′Sullivan, V., & O′Connell, B. C. (2014). Water fluoridation, dentition status and bone health of older people in Ireland. Community Dentistry and Oral Epidemiology.
Sheiham, A., & James, W. P. T. (2014). A reappraisal of the quantitative relationship between sugar intake and dental caries: the need for new criteria for developing goals for sugar intake. BMC Public Health, 14(1), 863.


Interesting that Stan Litras declined to reply to Ken’s post, citing such a lame reason for so doing. This is especially true given his association with Paul Connett who has far less of an understanding of fluoridation than does Ken, and certainly no greater educational level.
I, personally, am doubtful that Litras’ knowledge of fluoride and fluoridation is on a par with that of Ken, much less on a higher level, as he pompously implies in his reply to Ken’s offer. In all likelihood, this is the real reason he declined the offer.
Steven D. Slott, DDS
LikeLiked by 1 person
Speaking of cherry picking, see Limeback is telling lies again, on FFH page They claim in big letters that fluoride free Vancouver has better dental health than fluoridated Toronto, But the Canadian Health Ministry has a diffrent view
“”In BC, high concentrations of natural fluoride occur along the south east coast of Vancouver
Island, including the islands from Saltspring to Gabriola, and in the Okanagan from Okanagan
Falls to Salmon Arm (Ministry of Health 2002)”.
He must have forgotton to mention about the fluoride levels in Vancouver
LikeLiked by 3 people
A have emailed Hardy Limeback, Bruce Spittle and Stan Litras inviting them to comment here.
Heard back from Limeback only at this stage. He replied “Sorry. Not interested. Maybe later.”
And added a strange admission: “It looks like both sides cherry pick from the literature.”
LikeLike
Re the Chris Neurath graph of the WHO data. Sadly the British Medical Journal Editors saw fit to print the infamous graph.
BMJ. 2007 Oct 6;335(7622):699-702.
Adding fluoride to water supplies.
Cheng KK1, Chalmers I, Sheldon TA.
Does anyone know when the WHO will update these survey data. It could well be the case that these survey incidence curves are now on the uptick
see:
Journal of Dental Research
published online 29 May 2013
W. Marcenes, et al
Global Burden of Oral Conditions in 1990-2010 : A Systematic Analysis
and
Am J Dent. 2009 Feb;22(1):3-8.
The global increase in dental caries. A pending public health crisis.
Bagramian RA, Garcia-Godoy F, Volpe AR.
LikeLiked by 1 person
Chris I got this from the Environmental; Protection Division, Canada “The two largest population centres in British Columbia, Greater Victoria and Greater Vancouver, do not fluoridate their water. They draw water from large watershed reserves and the water is virtually all recent rainfall or snowmelt and low in fluoride.” On another site they listed the fluoride level of Vancouver water as 0.05 ppm.
LikeLike
ok .05 PPM is ok the water does have natural fluoride, and then when you add other sources it probably come up a point
LikeLike
http://www.collective-evolution.com/2013/04/10/banned-ted-talk-rupert-sheldrake-the-science-delusion/
LikeLike
Is that all you have got to say to my article, Trev?
The words “pearls before swine” come to mind.
Anything to avoid facing up to reality, I guess.
None of Stan’s mates seem prepared to defend his article. None!
And he is very silent.
LikeLike
Chris even distilled water has fluoride in it. I think you’re trying to be misleading. 0.05 ppm is very low compared to fluoridated water at 0.7 ppm. Whichever way you want to look at it Vancouver does not fluoridate (they stopped) and has very low levels of fluoride ( 0.05ppm) compared to Toronto which fluoridates to about 0.7 ppm.
Perhaps you are thinking of 0.5ppm as opposed to the actual figure of 0.05. Big difference.
LikeLike
Shane, could you provide links to back up the claims you are making about Toronto and Vancouver? That will allow a proper discussion
LikeLike